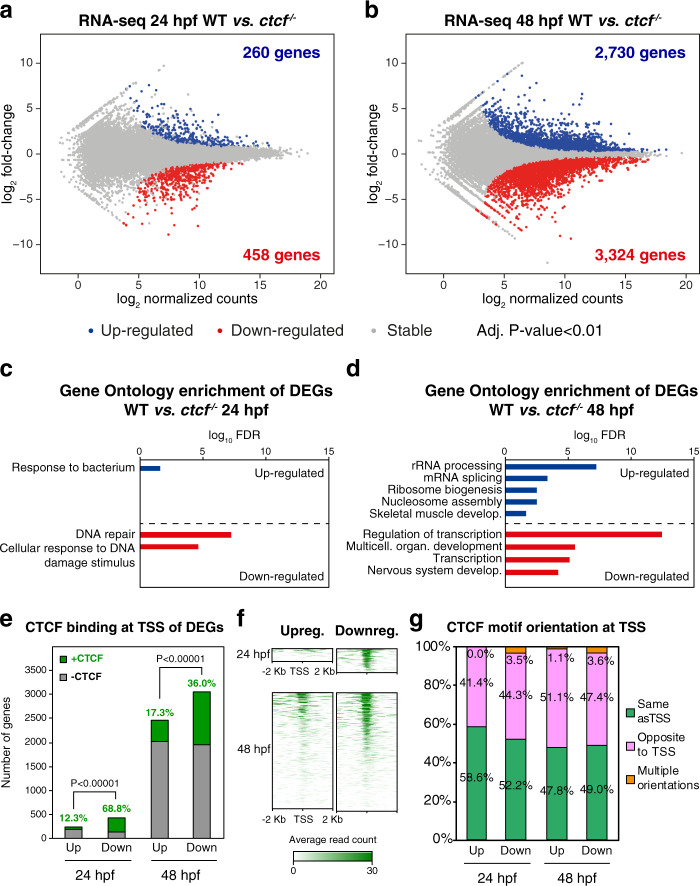
Fig. 2. CTCF absence in zebrafish embryos leads to altered developmental gene expression.
a, b Differential analyses of gene expression between WT and ctcf−/− embryos at 24 (a) and 48 hpf (b) from RNA-seq data (n = 2 biological replicates per condition). The log2 normalized read counts of WT transcripts versus the log2 fold-change of expression are plotted. Transcripts showing a statistically significant differential expression (adjusted P-value < 0.01) are highlighted in blue (upregulated) or red (downregulated). The number of genes that correspond to the upregulated and downregulated transcripts are shown inside the boxes. c, d Gene Ontology (GO) enrichment analyses of biological processes for differentially expressed genes (DEGs) in ctcf−/− embryos at 24 (c) and 48 hpf (d). Terms with a false discovery rate (FDR) < 0.05 are shown and considered as enriched. e Number of differentially expressed genes (DEGs) at 24 and 48 hpf showing (green) CTCF binding at their transcription start sites (TSS) or not (gray). f Heatmaps showing CTCF ChIP-seq signal around the TSS of DEGs at 24 and 48 hpf. g Percentage of CTCF motif orientation at ChIP-seq peaks overlapping TSS and relative to transcriptional orientation.

