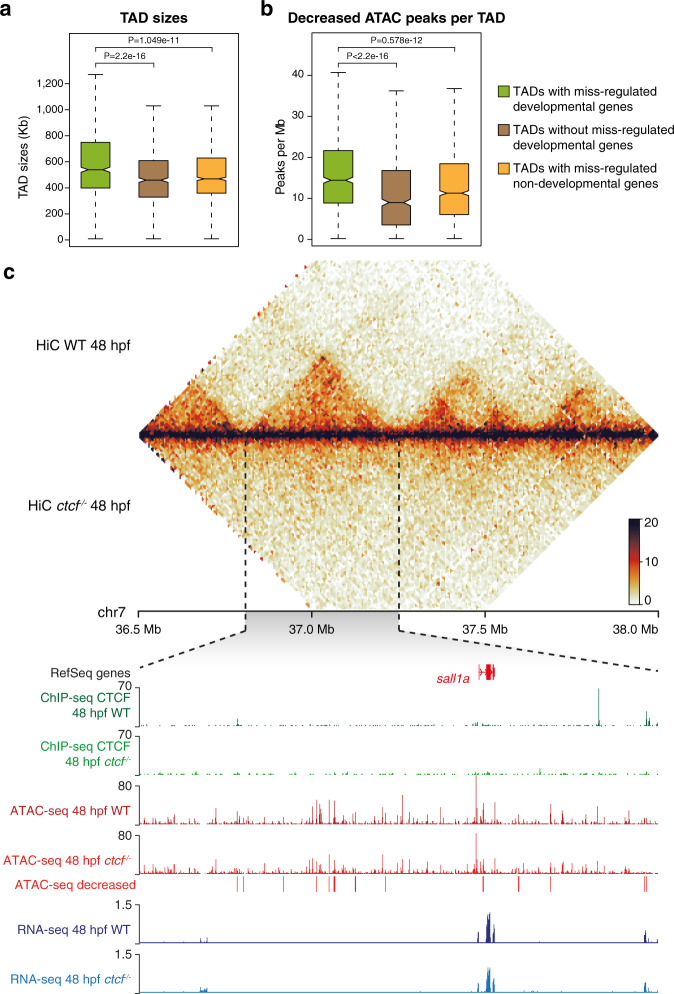
Fig. 5. Clusters of cis-regulatory elements around developmental genes lose accessibility upon CTCF loss.
a, b Box plots showing the TAD sizes (h) and the number of decreased DARs per Mb (i) for TADs containing developmental miss-regulated genes, TADs not containing developmental miss-regulated genes, and TADs containing only non-developmental miss-regulated genes. Boxplots represent the centerline, median; box limits, upper and lower quartiles; whiskers, 1.5× interquartile range; notches, 95% confidence interval of the median. Statistical significance was assessed using a two-sided Wilcoxon’s rank-sum test. c Top, heatmaps showing HiC signal in WT and ctcf−/− embryos at 48 hpf in a 1.5-Mb region of chromosome 7. Bottom, zoom within the sall1a TAD showing tracks with CTCF ChIP-seq, ATAC-seq, and RNA-seq at 48 hpf in WT and ctcf−/− embryos, as well as decreased ATAC-seq peaks. The downregulated sall1a gene is shown in red.

