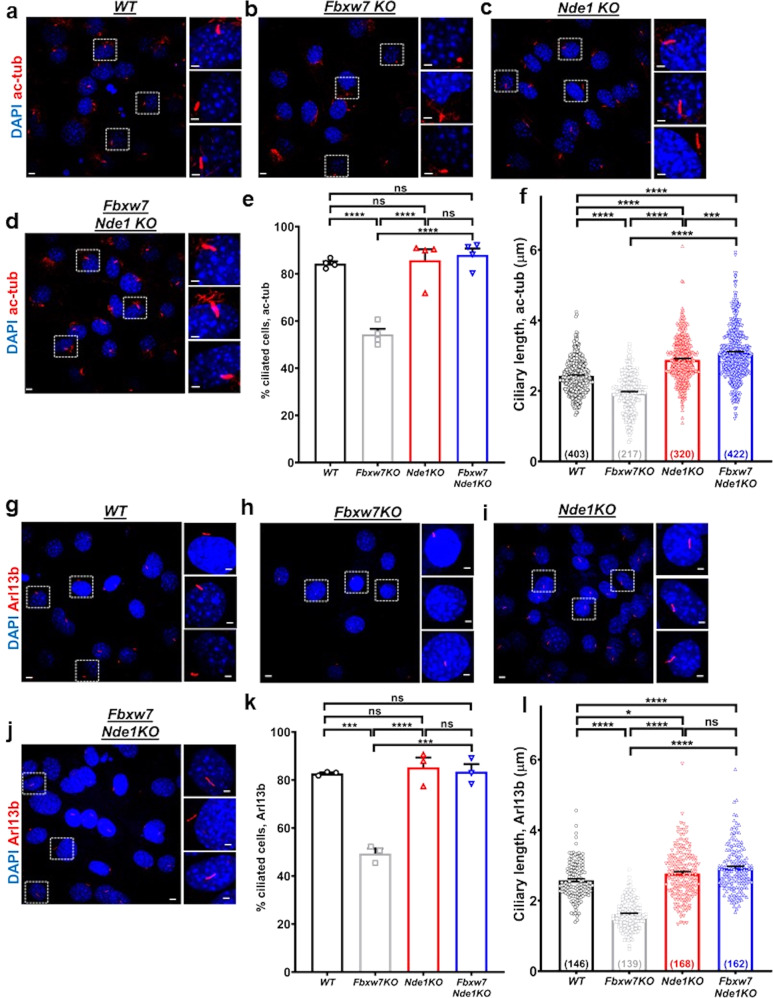
Fig. 4. FBW7 reduces cilia formation and length via NDE1 in the C3H10T1/2 stem cell line.
a–d Representative images of wild type, Fbxw7KO, Nde1KO, and Fbxw7/Nde1KO C3H10T1/2 cells after 24 h of serum starvation stained for primary cilia (acetylated α-tubulin, red). Percentages of ciliated cells (e) and ciliary length (f) in wild type, Fbxw7KO, Nde1KO, and Fbxw7/Nde1KO C3H10T1/2 cells. Hundred to hundred and fifty cells were analyzed per experiment (n = 3) in e. For ciliary length analysis, the number of cells analyzed is indicated at the bottom of each bar in f. Scale bars: 5 µm. Scale bars in insets: 2 µm. Data are presented as means ± SEM. One-way ANOVA with Sidak’s multiple comparisons test, ***p < 0.001, ****p < 0.0001. g–j Representative images of wild type, Fbxw7KO, Nde1KO, and Fbxw7/Nde1KO C3H10T1/2 cells after 24 h of serum starvation stained for primary cilia (Arl13B, red). Percentages of ciliated cells (k) and ciliary length (l) in wild type, Fbxw7KO, Nde1KO and Fbxw7/Nde1KO C3H10T1/2 cells. Hundred to hundred and fifty cells were analyzed per experiment (n = 3) in k. For ciliary length analysis, the number of cells analyzed is indicated at the bottom of each bar in f. Scale bars: 5 µm. Scale bars in insets: 2 µm. Data are presented as means ± SEM. One-way ANOVA with Sidak’s multiple comparisons test, ***p < 0.001, ****p < 0.0001.

