
Fig. 3. Structure-dependent light absorption and emission.
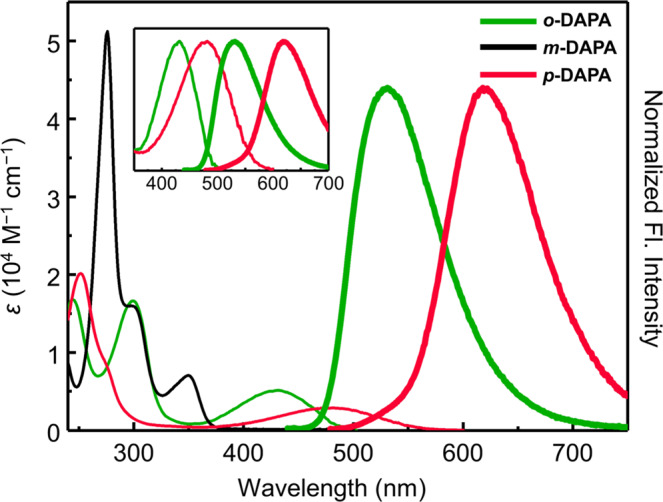
Absorption (thin lines) and normalized emission (thick lines) spectra of o-DAPA (green), m-DAPA (black), and p-DAPA (red) in CHCl3 (sample concentrations = 50 μM). The inset compares the absorption (thin lines) and emission (thick lines) spectra of o- and p-DAPA; the absorption spectra are normalized to the absorbance at the longest maximum absorption wavelengths (λmax,abs), whereas the emission spectra are normalized to the maximum fluorescence intensity. Fl., fluorescence.