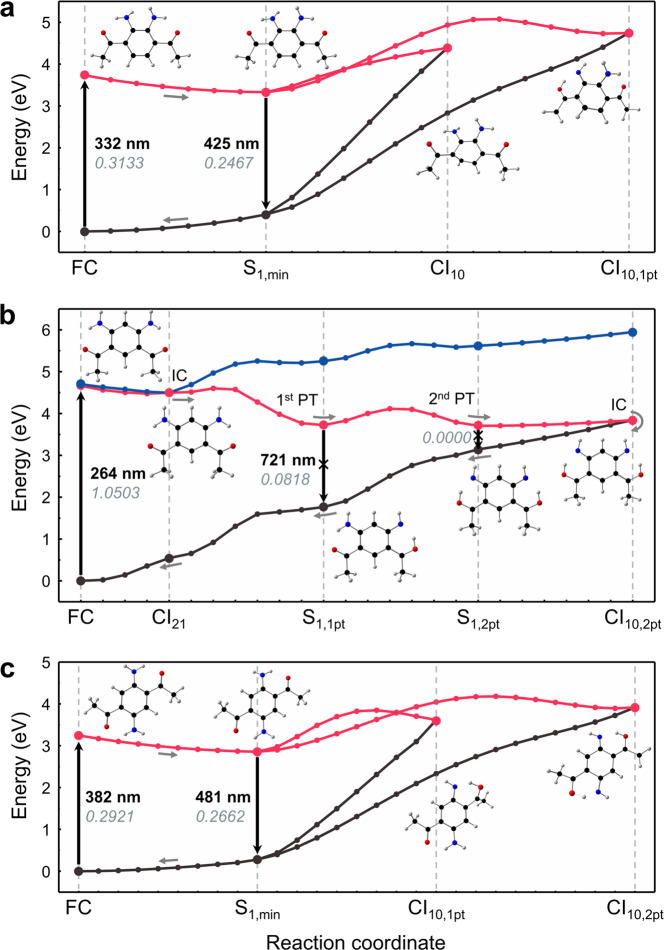
Fig. 5. Potential energy surfaces.
Calculated S0 (black), S1 (red), and S2 (blue) potential energy surfaces of o-DAPA (a), m-DAPA (b), and p-DAPA (c). The geometries were optimized at the MRSF/BH&HLYP/6-31 G* level of theory. Using computed structures, minimum energy paths (MEPs) were constructed, and optimized using the geodesic interpolation method55. For each transition, calculated wavelengths and oscillator strengths are shown in bold and italic, respectively. FC Franck–Condon region, CI conical intersection, IC internal conversion, PT proton transfer.

