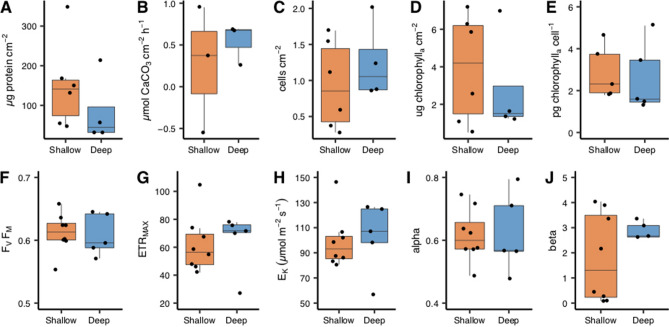
Figure 2.
Physiological and photochemical analyses of Oculina patagonica from 30 m ('Deep', blue boxes) and 2 m ('Shallow', red boxes) water depth. Subplots in upper panel are (A) protein concentration, (B) calcification rate, (C) algal cell density normalized to protein concentration, (D) chlorophyll concentration per skeletal surface area, (E) chlorophyll concentration per algal cell. Lower panel (F) maximum quantum yield, (G) relative maximum electron transport rate, (H) saturating irradiance (µmol m−2 s−1), (I) photosynthetic efficiency at light limiting irradiances, (J) the downward slope following maximal electron transport rate. Horizontal black lines within boxes are median values and box limits represent 1st and 3rd quartiles. Whiskers represent 1.5 times the interquartile range. Round black points are individual sample data.

