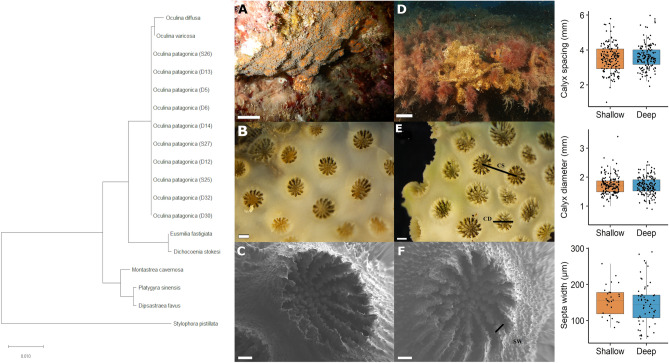
Figure 3.
Verification of species identity of all colonies collected as Oculina patagonica, using both genomic (CO1 gene sequencing) and morphological features. The evolutionary history was inferred using the Neighbour-Joining method and evolutionary distances were computed using the Maximum Composite Likelihood method (units: number of base substitutions per site) using the software MEGA X. Images (A–C) are of shallow colonies and (D–F) deep colonies. CS Calyx spacing, CD Calyx diameter, SW Septa width. Scales bar lengths are 1 cm (A, D, in situ), 1 mm (B, E, binocular microscopy), and 100 μM (C, F, scanning electron microscopy, mag. × 60). Graphs in the right panel display measured skeletal features on O. patagonica from 30 m ('Deep', blue boxes) and 2 m ('Shallow', red boxes) water depth. Horizontal black lines within boxes are median values and box limits represent 1st and 3rd quartiles. Whiskers represent 1.5 times the interquartile range. Round black points are individual sample data. No statistically significant differences were present between deep and shallow corals (Student’s t-test, p ≥ 0.05).

