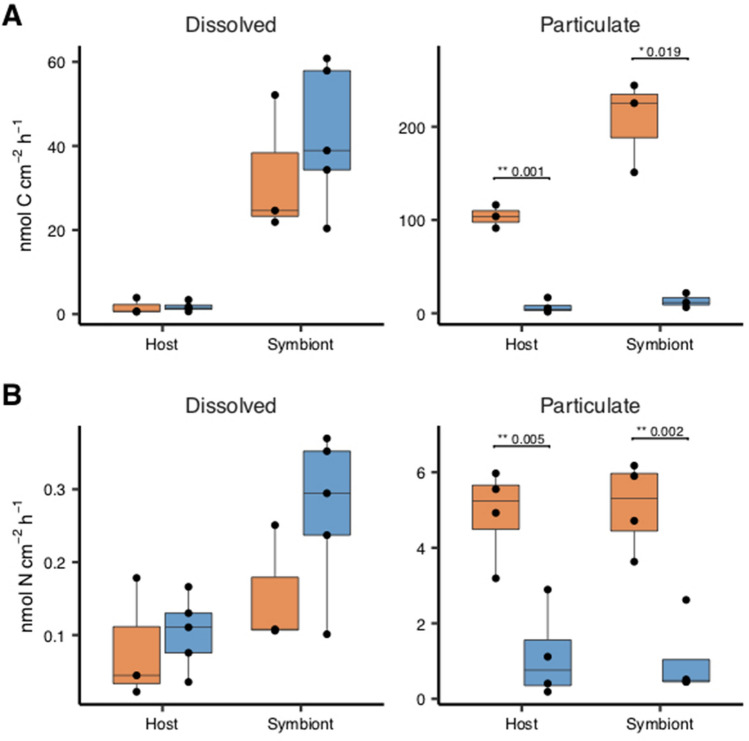
Figure 4.
Carbon (top panel) and nitrogen (bottom panel) assimilation rates in the coral host tissue and algal symbionts via heterotrophy. Colonies originate from 30 m ('Deep', blue boxes) and 2 m ('Shallow', red boxes) water depth. Horizontal black lines within boxes are median values and box limits represent 1st and 3rd quartiles. Whiskers represent 1.5 times the interquartile range. Round black points are individual sample data. No statistically significant differences were present between deep and shallow corals in the dissolved fraction (Student’s t-test, p ≥ 0.05) but differences found in the uptake of particulate matter are displayed.

