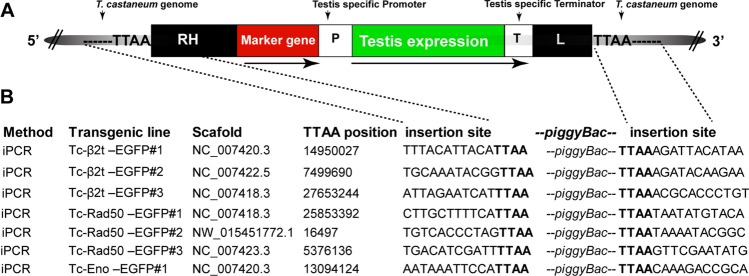
Figure 11.
Inverse PCR strategies to isolate and sequence the piggyBac vector and insertion sites in different transgenic lines. (A) Schematic diagram (not to scale) of the piggBac vector insertion in the T. castaneum genome. The vector contained the marker cassette as a visual marker and piggyBac inverted repeats (RH and L) for transposase mediated integration in T. castaneum genome. P putative promoter region, T putative terminator region. Duplicated TTAA flanked the piggyBac elements in the host genome. (B) Below are shown the TTAA position in the T. castaneum genome where the transgenes were inserted and the flanked piggyBac transgenes insertion site sequences from the transgenic lines.

