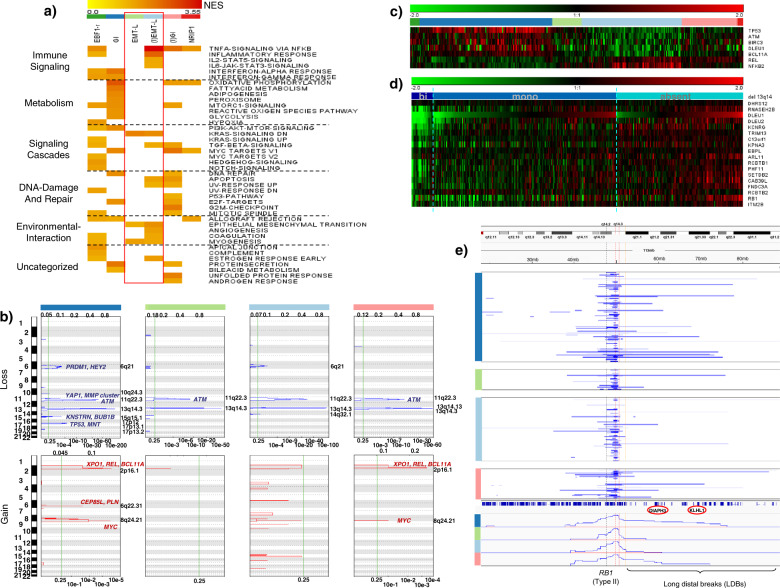
Fig. 2. Pathway activation and genetic alterations in CLL subtypes.
a Heatmap showing overrepresented gene sets (FDR < 0.05) identified through GSEA. The intensity range of normalized enrichment scores (NES) illustrates the degree of enrichment in CLL subtypes. Gene sets are grouped together according to the biological context. CLL subtype color code defined in Fig. 2a applies for Fig. 2a–c, e. b GISTIC analysis of copy number alterations (CNA). Chromosomal positions (1–22) on the y-axis (left) indicate losses (blue, upper panels) or gains (red, lower panels) for major clusters. Affected genes representing CNA targets within biological networks (such as YAP1) are shown for respective peaks. The most significant chromosomal peaks for major clusters are indicated on the right of each panel. GISTIC q-values at each locus are plotted from left to right on a log scale (bottom of each panel). Altered regions with FDR q ≤ 0.25 (vertical green line) are considered significant. GISTIC G-Scores (amplitude of the aberration × frequency of its occurrence across samples) are plotted on top of the panels. c Heatmap showing GEP of genes located within or adjacent to the minimally deleted or minimally gained regions of recurrent aberrations (n = 337). FDRs for DEGs ((I)EMT-L vs. GI) are highly significant (q < 1e−07). d Heatmap showing GEP of genes located at/adjacent to the minimally deleted region on 13q (n = 335). The blue color code indicates deletions (dark blue: biallelic; light blue: monoallelic) and the absence of del(13q) (cyan blue). Genes are ordered corresponding to chromosomal positions for the region between DLEU1 and RB1. e Visualization of del(13q) per case (blue horizontal lines). y-Axis: cluster color code, x-axis: representative genes and topography for the cumulative coverage of segment breaks per cluster. A vertical black dotted line indicates the RB1 locus. Vertical red dotted lines indicate the majority of distal losses (around 50–51 mb). Losses extending to the distal end of cytoband 13q14.3 (orange dotted line) are variably distributed. LDBs involve/exceed the majority of cytoband 13q21.1 (distal of 54.7 mb). Biallelic deletions of 13q14 mostly cover a small region and rarely occur together with larger 13q deletions. For Fig. 2a–e, data within individual figures derives from biologically independent samples.

