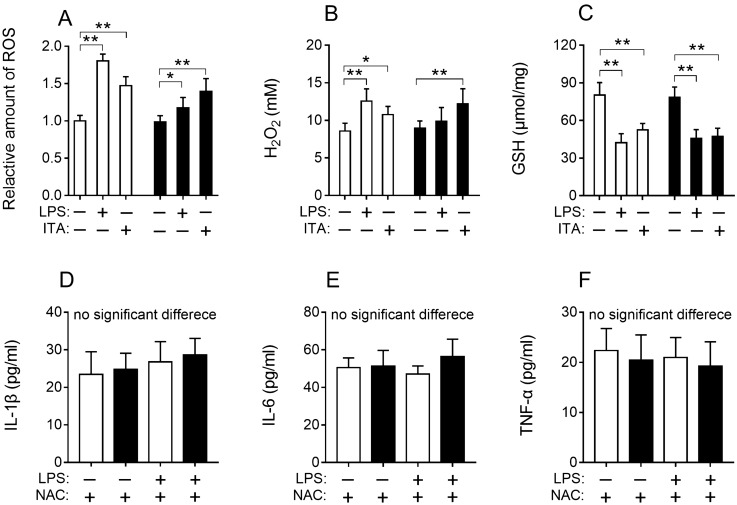
Figure 2.
Results of ROS level in cell (A), H2O2 in cell medium (B) and GSH level (C) in cell lysate. The levels of IL-1β (D), IL-6(E), TNF-α (F) in cell culture medium from RAW264.7 and RAW264.7-IRG1KO with different treatments (24 h). White bar, RAW264.7; black bar, RAW264.7-IRG1KO. LPS, lipopolysaccharide; ITA, itaconic acid; NAC, N-acetyl-L-cysteine. Relative ROS amount in cells with different treatments was normalized to RAW264.7 control and represents the fold change. Values represent the mean ± S.E.M. *, p < 0.05; **, p < 0.01.

