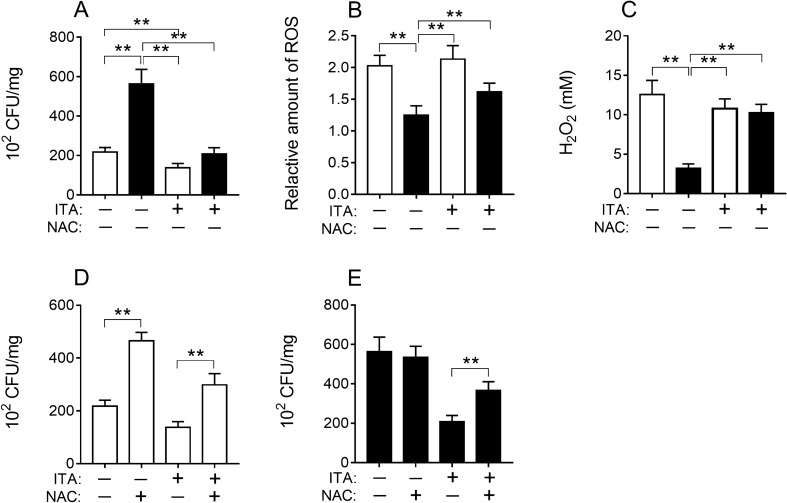
Figure 5.
Growth of S. typhimurium in cells (A, D, E) and levels of ROS (B), H2O2 (C) in S. typhimurium infected cells and culture medium under different treatment conditions (24 h). White bar, RAW264.7; black bar, RAW264.7-IRG1KO. ITA, itaconic acid; NAC, N-acetyl-L-cysteine. Relative ROS amount in cells with different treatments was normalized to RAW264.7 control (NAC) and represents the fold change. Values represent the mean ± S.E.M. **, p < 0.01.

