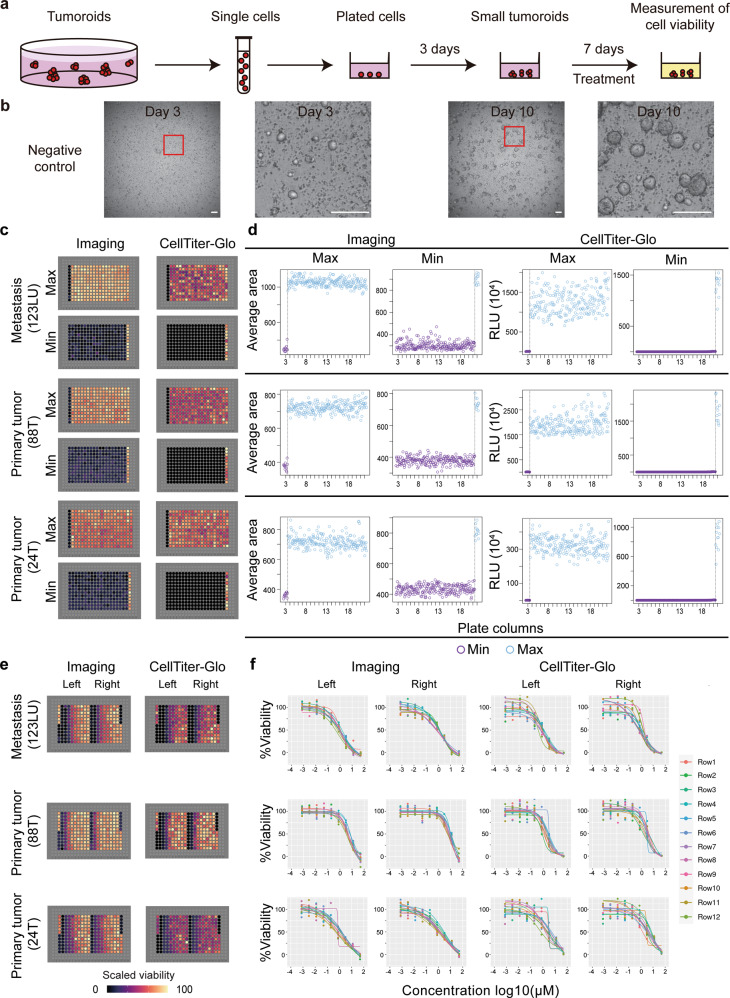
Fig. 8. Plate uniformity of tumoroid viability assays with low-viscosity matrix suspension culture in 384-well format.
a Schematic of the workflow for tumoroid viability assessment. Established tumoroids were dissociated and seeded as single cells, grown into small tumoroids over 3 days and treated with drug for 7 days with daily bright-field z-stack imaging. Cell viability was determined by both image analysis and CellTitre-Glo 3D assays. b Representative images of vehicle-treated tumoroids in 384-well format on day 3 and day 10 of the assay, scale bars, 100 μm. c–d Tumoroids from three patients were examined for uniformity of maximum (Max) and minimum (Min) signals; (c) plate signals were visualized by heat maps, and (d) raw signals of mean tumoroid size or relative luminescence units (RLU) were plotted against the respective plate column. e-f Tumoroids from three patients were examined for uniformity of drug dose-response curves; (e) plate signals were visualized by heat maps, and (f) four-parameter logistic regression was used to fit drug dose-response curves for each side of each plate (left and right); each color represents a different plate row. T tumor, LU lung metastasis.

