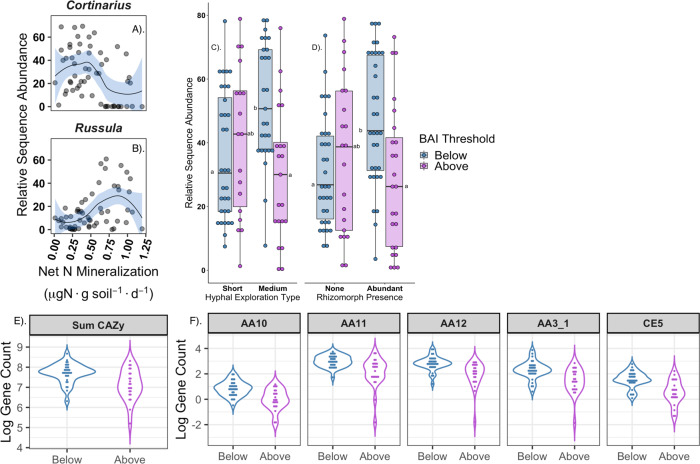
Fig. 3. Compositional, morphological and functional turnover along the soil nitrogen gradient consistent with shifts in ectomycorrhizal (ECM) fungal N foraging traits.
A, and B relative sequence abundance of the ECM fungal genera Cortinarius and Russula along the gradient of net N mineralization rates (x-axis). Colored bands depict GAM fits. C Box-and whisker plot depicting ECM fungi forming short or medium-distance exploration types. Letters denote statistical significance D. ECM fungi forming rhizomorphic hyphae above and below the BAI statistical threshold (0.53 µgN g soil−1 day−1); letters adjacent to median line of box, denote statistical significance, points are individual communities totaling n = 58. Upper and lower hinges depict 25th and 75th percentiles. E Sum of CAZy gene counts (n = 100 gene families). F Specific gene families (headers) significantly enriched below the BAI change point. AA10, AA11 encode lytic polysaccharide monooxygenases, AA12 is an oxidoreductase, AA3_1: cellobiose dehydrogenase, CE5: acetyl xylan esterase.

