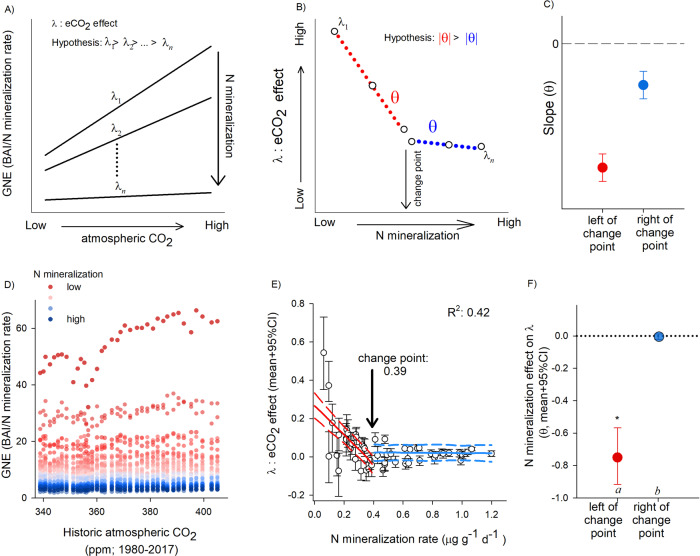
Fig. 4. Analysis framework and evidence for context-dependent iCO2 fertilization responses.
A Representative analysis framework of growth-nitrogen efficiency index (GNE) as a function of increasing concentrations of historic atmospheric CO2 at each point along the net N mineralization gradient (different lines and their relative slopes). B Conceptual diagram of the effects of iCO2 (λ) on plant growth; change point analysis can detect an inflection point along the soil gradient, if any. C Differences in derived from the red and blue portion of panel B, indicate distinct slope values. D Dendrochronological data collected from 54 Q. rubra trees from the past 38 years. Individual points represent estimated annual GNE values colored by tree-specific rates of net-N mineralization. E Individual points represent individual trees response to iCO2 (mean model slopes derived from D) over the study period. Red and blue lines denote Bayesian change-point model with plotted 95% PI (dashed lines; estimated at average values of other covariates) (n = 54). F Denotes mean and 95% CI for the red and blue slopes depicted in E; different letters denote significant differences between slopes, asterisks indicate significant differences from zero (95% CI do not include zero; n = 54).

