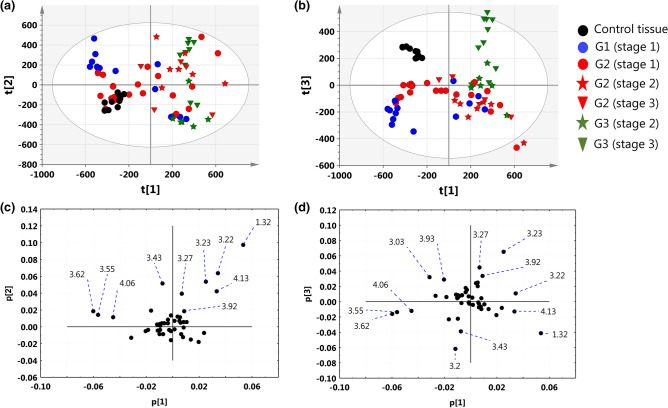
Figure 3.
The PCA scores plots obtained from the model 1 (in the parentheses there are the percentage values of the total variation in the given projection plane) for: (a) PC1–PC2 (44.2%), (b) PC1–PC3 (35.41%). The loadings plots for: (c) PC1–PC2, (d) PC1–PC3. The points in the scores plots are marked according to the disease stage and tumors grade, while the points in the weights plots are labeled according to the chemical shifts. For clarity, the most important chemical shifts are presented. The scores plots (a,b) were created using SIMCA-P 15.0 software package (https://www.sartorius.com). The loadings plots (c,d) were created using Statistica 12.5 software (www.statsoft.pl) based on data exported from SIMCA-P 15.0 software package (https://www.sartorius.com).

