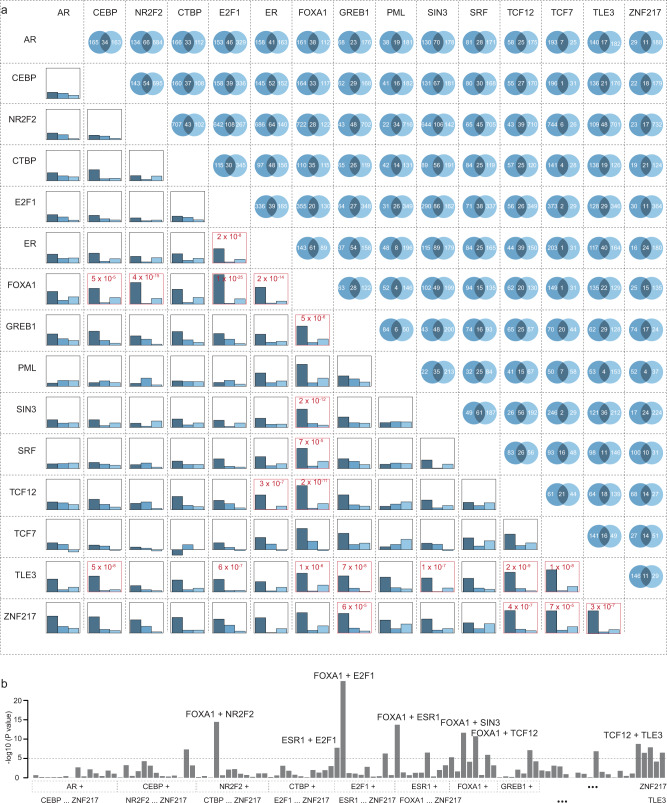
Fig. 2. Association of co-occupancy of two TFs with breast cancer risk in BCAC data.
a In the upper-right triangle, the numbers of genetic variants (multiplied by 1000) that are occupied by specific TFs or co-occupied by two TFs were showed for each TF pair. In the lower-left triangle, barplots showing the association strengths (regression coefficients) for the genetic variants occupied by two TFs (only first TF and only second TF, respectively) as indicated by dark blue to gray-blue colors. Two TFs with significant interactions at P < 1 × 10⁻⁵ were highlighted in red. b Barplots show interaction between two TFs with significant interactions indicated on the top: FOXA1 + E2F1, FOXA1 + NR2F2, FOXA1 + ESR1, FOXA1 + SIN3, and FOXA1 + TCF12, at P < 1 × 10⁻⁵.

