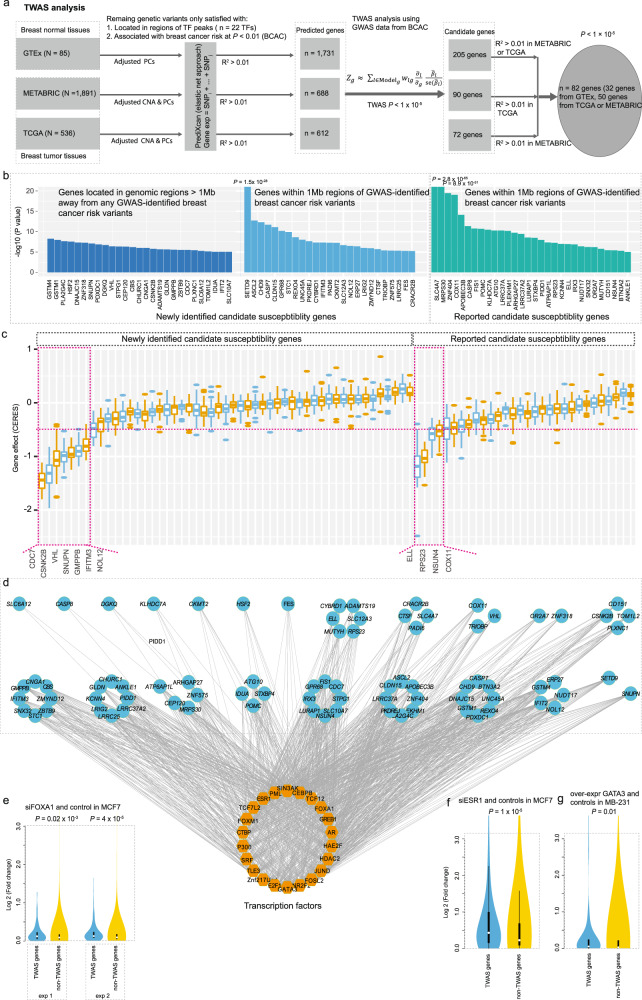
Fig. 5. TWAS analysis using an improved model building and core TF-transcriptional network regulating the identified susceptibility genes formed by FOXA1 and co-factors.
a Flow chart to illustrate the TWAS analysis using the improved model building based on putative regulatory variants occupied by the identified 22 risk-associated TFs. b Barplots show association of breast cancer risk with TWAS-identified genes, separated by previously unidentified ones: far away GWAS loci (>1 Mb) and within GWAS loci (<1 Mb), and previously reported ones. c Boxplot shows TWAS-identified genes effects on cell proliferation using experimental data from CRISPR (Avana) public 20Q3. A total of 11 genes, including seven previously unidentified (left panel) and four previously reported ones (right panel) showed evidence of essentiality on cell proliferation based on a cutoff of median CERES values < −0.5. d The TWAS-identified genes regulated by TF networks based on the putative regulatory variants occupied by the identified TFs. e–g Boxplots show that TWAS-identified genes had higher folds of changes than non-TWAS-identified genes, based on gene-expression data generated by FOXA1 (e), ESR1 (f), and GATA3 (g) silence/over-expression and control breast cancer cells. In the boxplots shown in these figures, the whiskers denote the range, the boxes denote the interquartile range; the middle bars in c or middle white points in e–g denote the median, and the violin shapes in e–g represent the data distribution. The two-sided nominal P-values shown in e–g were derived from the Wilcoxon-rank sum test.

