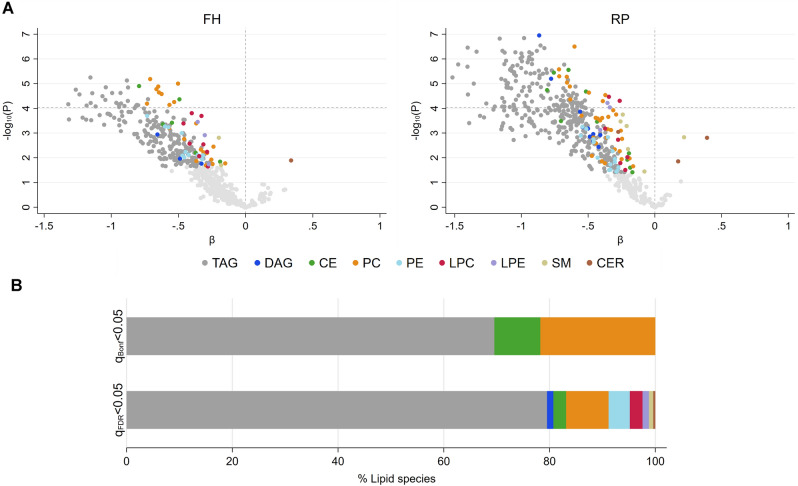
Figure 1.
Plasma lipid metabolite differences between cases and controls in Fred Hutch (FH) and Roswell Park (RP) patient cohorts. Log2 metabolite concentrations were regressed on case status with adjustment for age and BMI. (A) Volcano plots depicting estimated beta (β) coefficients and − log10 P values for 546 individual lipid metabolites (left: FH, right: RP). Species satisfying FDR q < 0.05 are color-coded by lipid class, as indicated, with the remainder shown in light gray. Dashed horizontal line marks the Bonferroni-corrected threshold for statistical significance: − log10 (0.05/546) = 4.04. (B) Lipid class assignments of species reaching qBonf < 0.05 (n = 23, top), or qFDR < 0.05 (n = 249, bottom), in both cohorts.

