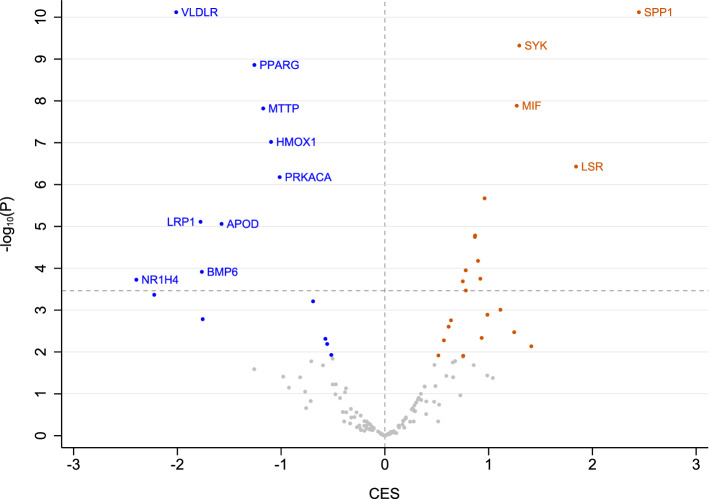
Figure 4.
Gene expression differences in malignant versus benign ovarian tumor tissues. Differential expression analysis of 145 selected lipid-transport-related genes was conducted using RNA profiling data extracted from the NIH GEO archive. Results obtained from four independent sample sets (total N = 106 malignant, N = 51 benign) were meta-analyzed using NetworkAnalyst. Combined effect sizes (CES) and − log10 P values are plotted. Genes satisfying FDR q < 0.05 are colored blue (downregulated) or orange (upregulated). Dashed horizontal line, Bonferroni-corrected threshold for statistical significance (− log10 (0.05/145) = 3.59).

