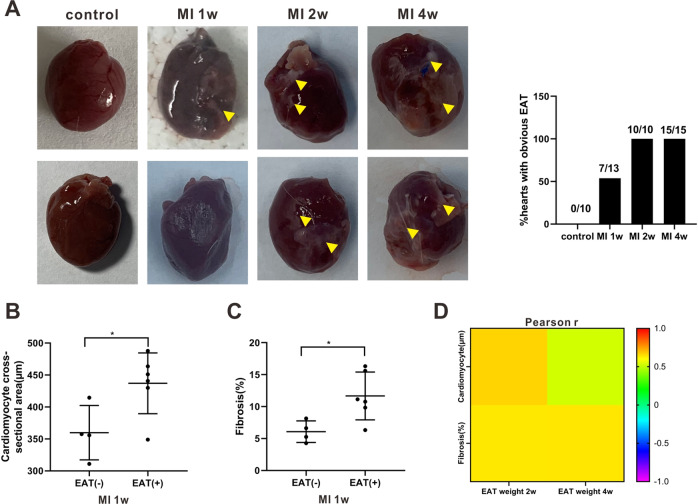
Fig. 2. The correlation between epicardial adipose tissue (EAT) and adverse myocardial remodeling.
A Left: Representative images of hearts of rats in the control, MI 1-week, MI 2-week, and MI 4-week groups. Triangles: obvious EAT. Right: The ratio of hearts with obvious EAT in each group. The (B) cardiomyocyte cross-sectional areas and (C) myocardial fibrosis areas in the rats with (+) or without (−) EAT in MI 1-week group. *P < 0.05. D Pearson’s correlation coefficient (r) of EAT weights and cardiomyocyte size/myocardial fibrosis areas in rats in the MI 2-week and MI 4-week groups.

