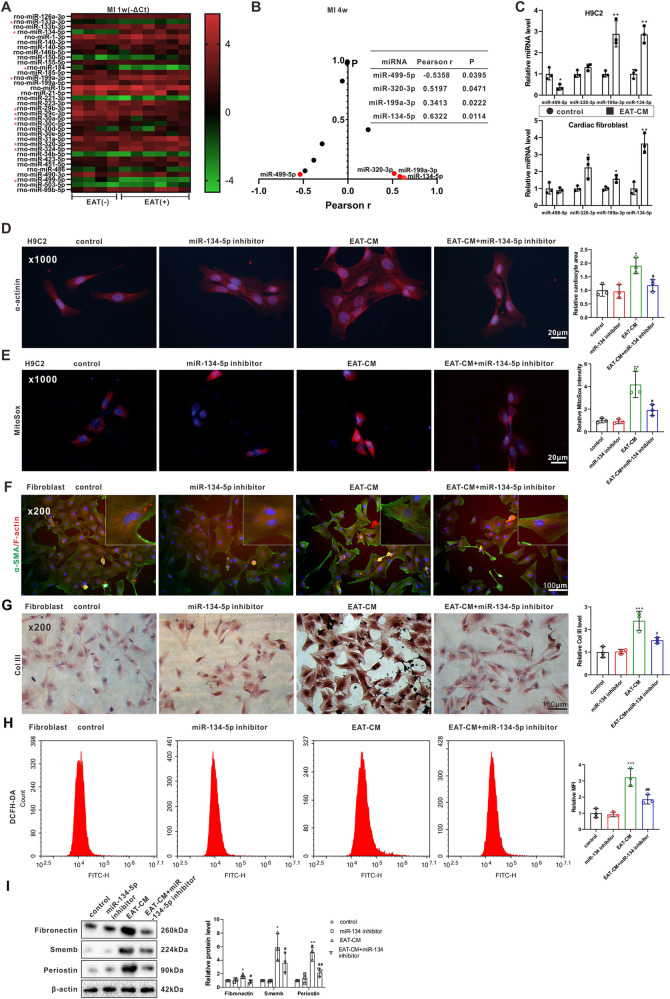
Fig. 4. The role of miR-134-5p in cardiomyocyte hypertrophy and cardiac fibroblast activation induced by secretory products from EAT.
A Expression profiles of 35 candidate miRNAs in the left ventricular tissues of rats with (+) or without (−) obvious EAT in MI 1-week group. B Pearson’s correlation coefficient (r) of EAT weights and expression levels of 11 differentially expressed miRNAs determined in (A) in MI 4-week group. C The expression levels of miR-499-5p, miR-320-3p, miR-199a-3p, and miR-134-5p were measured by qRT-PCR in H9C2 cells and primary rat cardiac fibroblasts cultured in DMEM-F12 medium or EAT-CM. D, E H9C2 cells were divided into control, miR-134-5p inhibitor, EAT-CM, and EAT-CM + miR-134-5p inhibitor groups. D Immunofluorescent staining for α-actinin (scale bar = 20 µm). Cell nuclei were counterstained with DAPI. E MitoSox fluorescence probe was used to observe the mitochondrial superoxide content (scale bar = 20 µm). Cell nuclei were counterstained with DAPI. F–I Primary rat cardiac fibroblasts were divided into control, miR-134-5p inhibitor, EAT-CM, and EAT-CM + miR-134-5p inhibitor groups. F Immunofluorescent staining for (F) α-SMA (green)/F-actin (red) (scale bar = 100 µm). Cell nuclei were counterstained with DAPI. G Immunohistochemical staining for CoI III (scale bar = 100 µm). H The intracellular ROS level was analyzed by flow cytometry using a DCFH-DA fluorescence probe. I The protein levels of fibronection, smemb, and periostin. β-actin was used as an internal control. *P < 0.05, **P < 0.01, ***P < 0.01 vs control; #P < 0.05, ##P < 0.01 vs EAT-CM.

