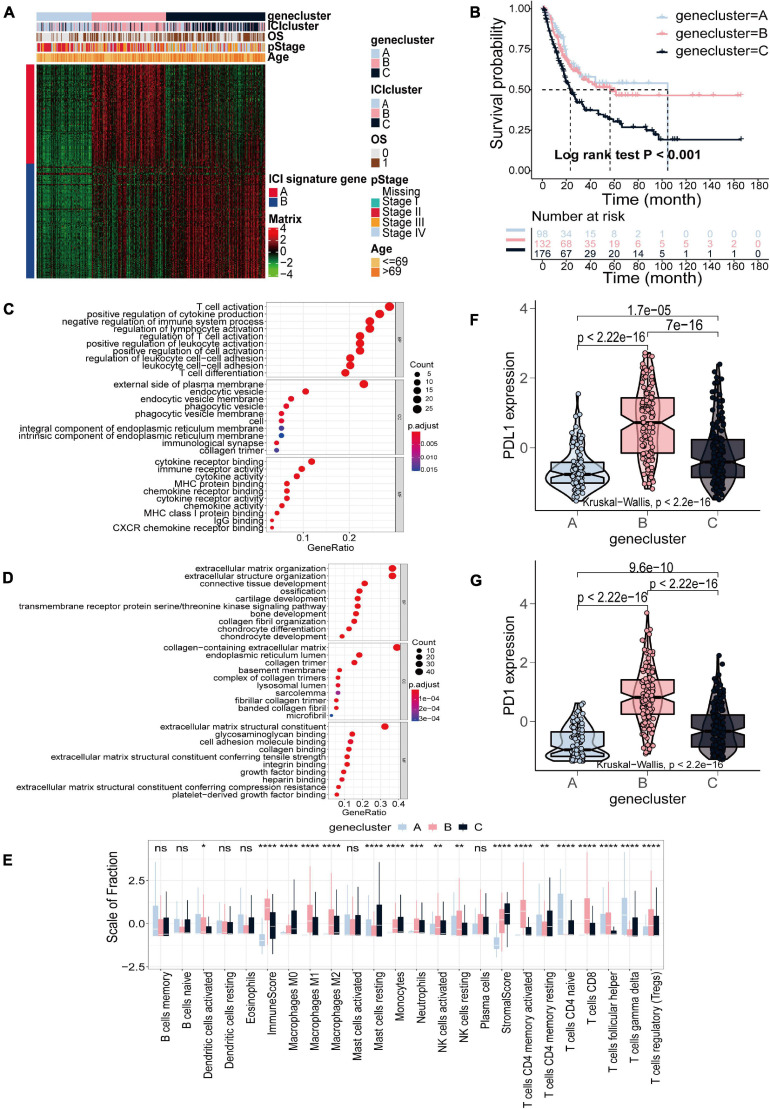
FIGURE 2.
Identification of gene subtypes based on DEGs in TCGA-BLCA cohort. (A) Consensus clustering of DEGs among three ICI subtypes. (B) Kaplan–Meier curves for OS of the three gene clusters (log-rank test, p < 0.001). (C,D) GO enrichment analysis of the two ICI-related signature genes: ICI signature genes A (C) and ICI signature genes B (D). (E) The fraction of TIICs, immune score and stromal score in three gene clusters (Kruskal–Wallis test, *p < 0.05; **p < 0.01; ***p < 0.001; ****p < 0.0001). (F,G) The difference in the expression of PD-L1 (F) and PD-1 (G) among three gene clusters (Kruskal–Wallis test, p < 2.2e-16).

