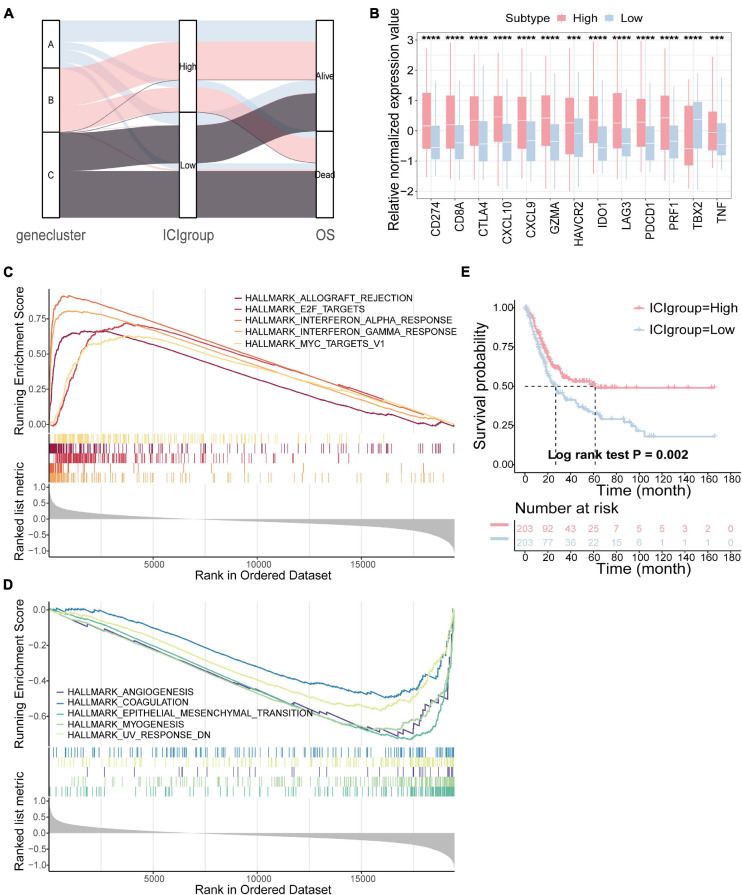
FIGURE 3.
Construction of the ICI score. (A) Alluvial diagram of gene cluster distribution in groups with different ICI score and survival outcomes. (B) The difference in the expression of immune checkpoint-related genes (IDO1, CD274, HAVCR2, PDCD1, CTLA4, and LAG3) and immune activity-related genes (CD8A, CXCL10, CXCL9, GZMA, PRF1, TBX2, and TNF) between high and low ICI score subgroups. (C,D) The gene set enrichment analysis (GSEA) in high (C) and low ICI score subgroups (D). (E) Kaplan–Meier curves for high and low ICI score groups in the TCGA-BLCA cohort (log-rank test, p = 0.002). ***p < 0.001; ****p < 0.0001.

