FIGURE 7.
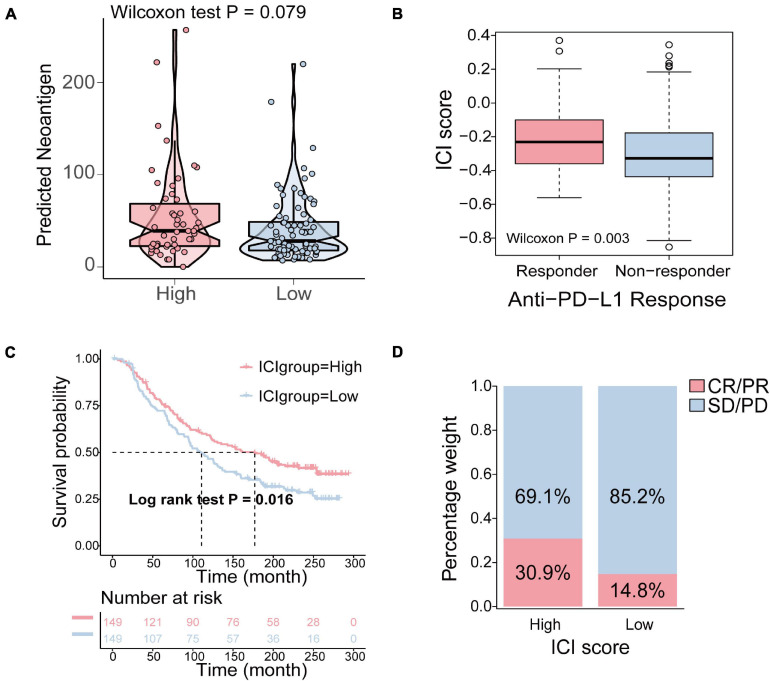
The relationship between the ICI score and antitumor immunity and the role of ICI pattern in anti-PD-L1 immunotherapy. (A) The difference of the number of neoantigens in the high and low ICI score groups (Wilcoxon test, p = 0.079). (B) The comparison of the ICI score in different anti-PD-1 clinical response statuses (Wilcoxon test, p = 0.003). (C) Kaplan–Meier curves for patients in the high and low ICI score group in the IMvigor210 cohort (log-rank test, p = 0.016). (D) The rate of clinical response to anti-PD-L1 immunotherapy in the high and low ICI score groups in the IMvigor210 cohort (CR, complete response; PR, partial response; SD, stable disease; PD, progressive disease).

