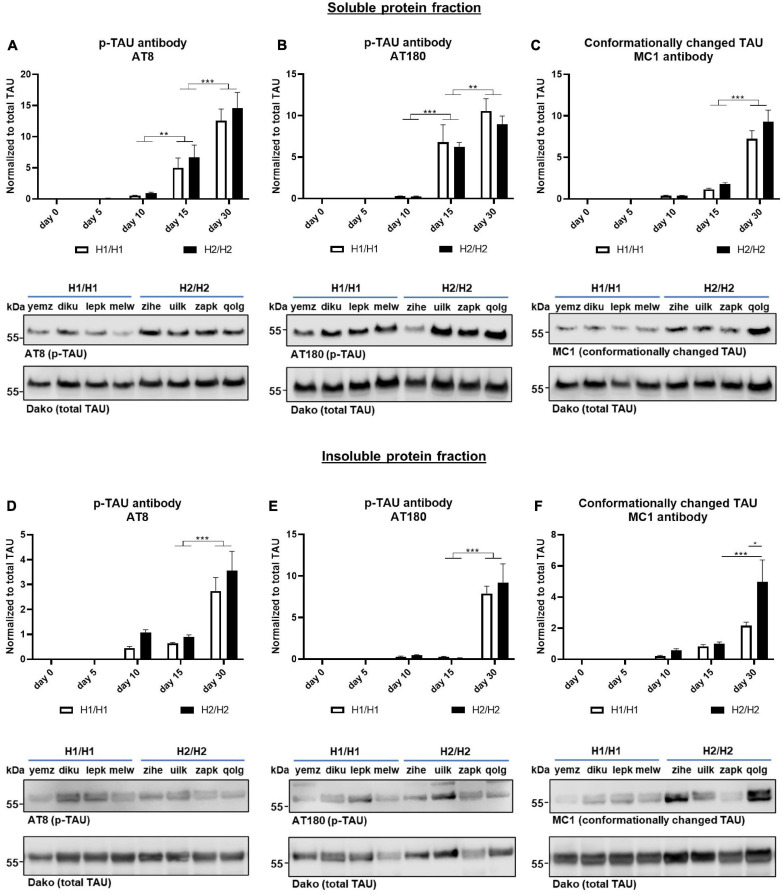
FIGURE 5.
Western blots for phosphorylated and conformationally changed TAU. Phosphorylated TAU (p-TAU) levels were investigated with the antibodies AT8 and AT180, conformationally altered TAU is detected with the MC1 antibody. Data for all antibodies were normalized to total TAU levels. (A–C) In the soluble protein fraction, p-TAU (A,B) and MC1 positive TAU (C) levels increase significantly over time with day 30 displaying the highest levels. (D–F) In the insoluble protein fraction, p-TAU (D,E) and MC1 positive TAU (F) levels also increase significantly over time. No significant differences could be detected between H1/H1 and H2/H2 haplotype groups for any of the antibodies except for MC1. Here, at day 30, the level in the H2/H2 group is significantly higher in the insoluble fraction than in the H1/H1 group. Data are represented as mean ± SEM of n = 4 cell lines for each haplotype group. For each cell line at least three independent repeats were analyzed. Two-way ANOVA followed by Tukey’s or Sidak’s test (MC1 Western blot) was performed. *p < 0.05, **p < 0.01, *** p < 0.001. Displayed Western blot pictures are representative blots from day 30 of differentiation for the respective antibody.

