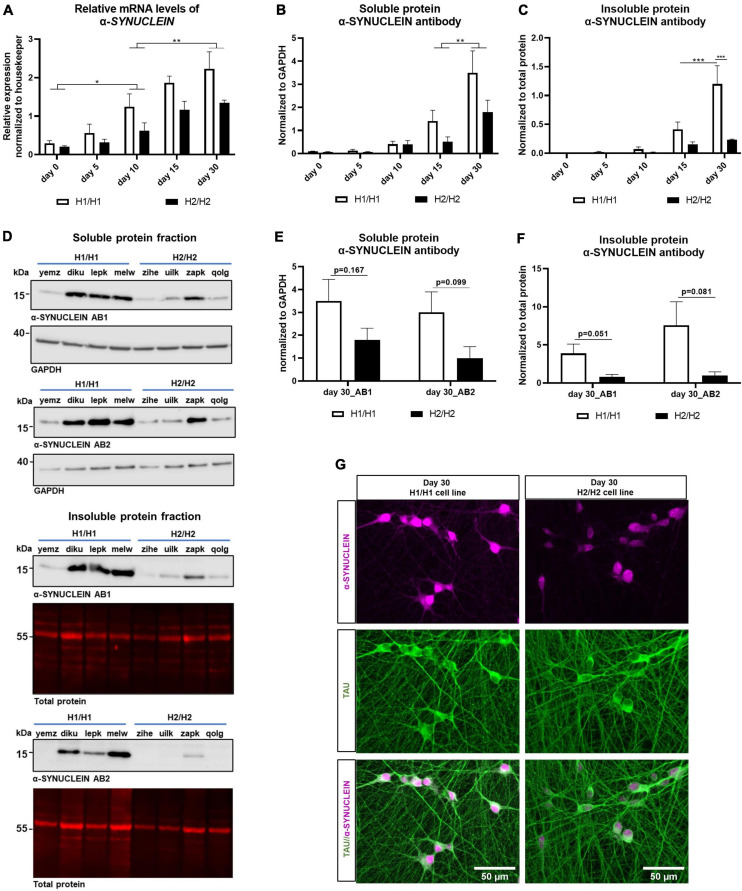
FIGURE 6.
Analysis of α-SYNUCLEIN expression over time on protein and mRNA level. (A) qPCR for α-SYNUCLEIN over differentiation time of 30 days. α-SYNUCLEIN levels increase significantly over time. Data are represented as mean ± SEM of n = 4 cell lines for each haplotype group. For each cell line at least two independent repeats were analyzed. Two-way ANOVA was performed and revealed a significantly higher expression in H1/H1 cells (p = 0.0011). For the factor time, a Tukey’s test was performed. *p < 0.05, **p < 0.01. (B,C) Western blot of soluble and insoluble protein fraction with α-SYNUCLEIN antibody over differentiation time of 30 days. α-SYNUCLEIN levels increase significantly over time in both fractions. Data are represented as mean ± SEM of n = 4 cell lines for each haplotype group. For each cell line at least three independent repeats were analyzed. Two-way ANOVA was performed followed by Tukey’s or Sidak’s test and revealed an overall significantly higher expression in H1/H1 cells (p = 0.036) compared to H2/H2 in the soluble fraction and a significantly higher level in H1/H1 cells at day 30 in the insoluble fraction. **p < 0.01, ***p < 0.001. (D) Representative Western blots from 30-day old cells for two α-SYNUCLEIN antibodies (AB1 and AB2) for the soluble and the insoluble fraction. (E,F) Western blot of soluble and insoluble protein with two α-SYNUCLEIN antibodies (AB1 and AB2) at day 30 of differentiation could not detect a significant difference between H1/H1 and H2/H2 groups with unpaired t-test. Data are represented as mean ± SEM of n = 4 cell lines for each haplotype group. For each cell line at least three independent repeats were analyzed. (G) Immunofluorescent staining of two representative cell lines for α-SYNUCLEIN and TAU at day.

