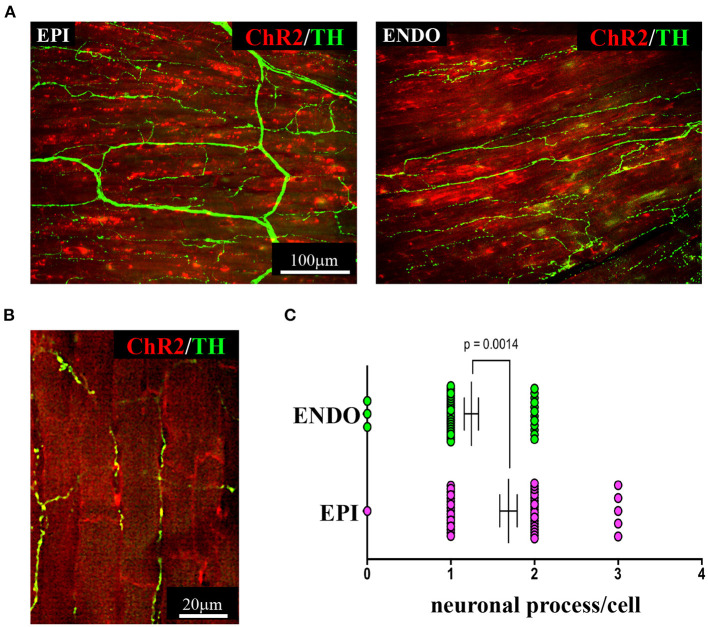
Figure 5.
Three-dimensional imaging of the neuronal network in the murine myocardium. (A) Maximum intensity projection of multiphoton image stacks acquired along 400 μm in tissue clarified LV blocks from the EPI and ENDO regions of a α-MHC/ChR2-td-Tomato mouse heart, stained with an antibody to TH. Red emission of td-Tomato was used to identify CM membrane. (B) Representative single optical section of a sample processed as in (A), resolving the neuro-cardiac interactions, and used for quantification of neuronal processes/cell in EPI and ENDO regions (C). (A–C) Modified with permission from Pianca et al. (2019).

