Figure 7.
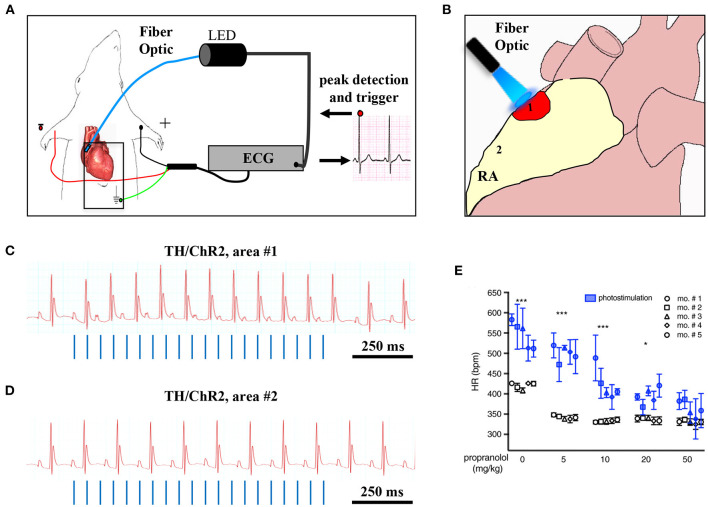
Optogenetic assessment of neuro-cardiac coupling in vivo. (A) Schematic illustration of the neuronal optogenetic set up used for right atrium (RA) illumination in open chest anesthetized mice. (B) Representation of the different photostimulated atrial regions (areas#1–2). (C) Representative ECG trace of the optogenetic experiment, showing positive chronotropic response upon photoactivation (blue lines) of the RA area#1 in TH/ChR2 mice. (D) Representative ECG trace showing unchanged HR upon illumination of RA area#2. (E) Dose-effect analysis of the treatment with the β-AR antagonist, propranolol, on the chronotropic response to neuronal photostimulation. Blue symbols identify responses to photostimulation, while the white ones show the effects of systemically delivered NA (***P < 0.001; *P < 0.05). Images modified with permission from Prando et al. (2018).

