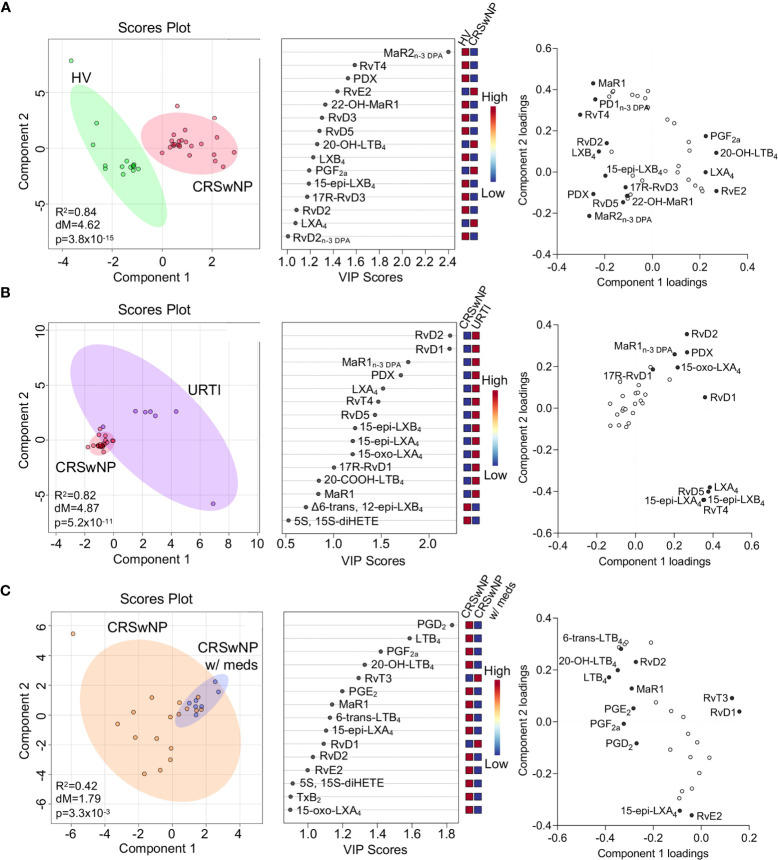
Figure 3.
Dysregulated lipid mediator profiles in plasma from CRSwNP when compared to both healthy volunteers and URTI. (A) Plasma was collected from patients with CRSwNP (n = 24) and healthy volunteers (HV, n = 15) LM concentrations were determined using LC-MS/MS based LM profiling (see methods for details). Differences in LM concentrations were evaluated using PLS-DA. (Left panel) 2-dimensional scores plot and (centre panel) corresponding VIP plot of plasma LM. (right panel) loading plot where mediators with VIP score >1 are annotated. (B). Plasma was collected from patients with CRSwNP (n = 24) and patients with URTI (n = 7) LM concentrations were determined using LC-MS/MS based LM profiling (see methods for details). Differences in LM concentrations were evaluated using PLS-DA. (Left panel) 2-dimensional scores plot and (centre panel) corresponding VIP plot of plasma LM. (right panel) loading plot where mediators with VIP score >1 are annotated. (C) Plasma lipid mediator concentrations were evaluated in patients receiving medication and those that were not. (Left panel) 2-dimensional scores plot and (centre panel) corresponding VIP plot of plasma LM. (right panel) loading plot where mediators with VIP score >1 are annotated. N = 7 for patients receiving medications (CRSwNP w/meds) and n = 17 for patients not receiving medications (CRSwNP). Shaded areas represent 95% confidence interval (CI), R2 = coefficient-of-determination, p = p-value from Hotelling’s T-squared test, dM = Mahalanobis distance between groups.

