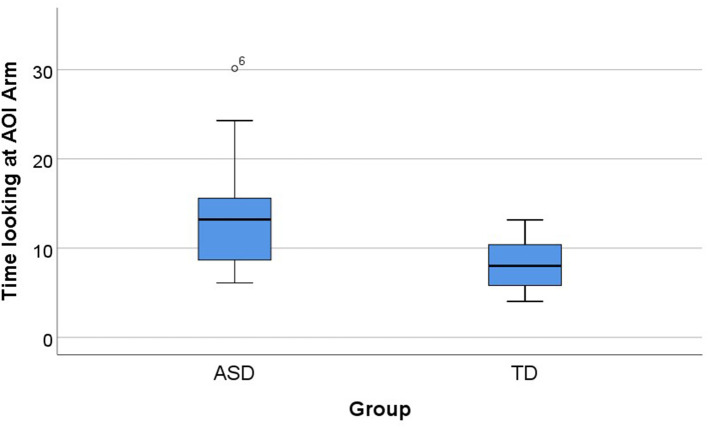
Figure 8.
Group differences in the AOI arm (U = 64.00, p = 0.009, d = 1.012). Total time for ASD and TD groups in the AOI arm in the social salient cue condition. Boxplots: central mark—median; edges of box−25th and 75th percentiles; whiskers—most extreme data points (minimum and maximum). AOI, area of interest; ASD, autism spectrum disorder group; TD, typical neurodevelopment group.

