
Fig. 4.
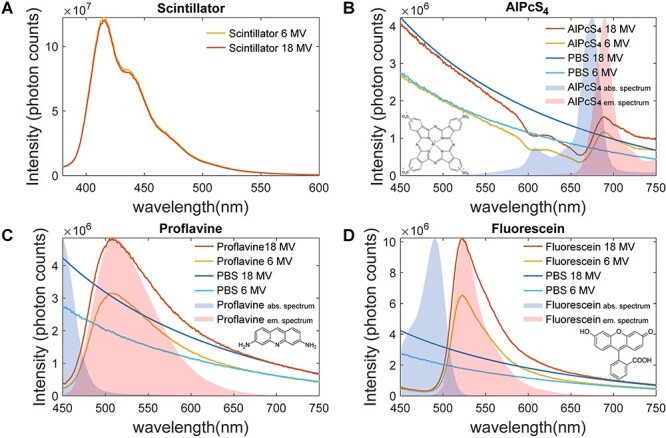
Comparison of 18 MV and 6 MV emission spectra for: (A) scintillator at a fixed dose level; and those for (B) AlPcS4; (C) Proflavine; and (D) Fluorescein in PBS. Each organic molecule spectra is overlapped with 18 MV and 6 MV PBS emission spectra as well as the molecules visible light absorption and emission spectra. Inset in each graph is its molecular bond diagram.