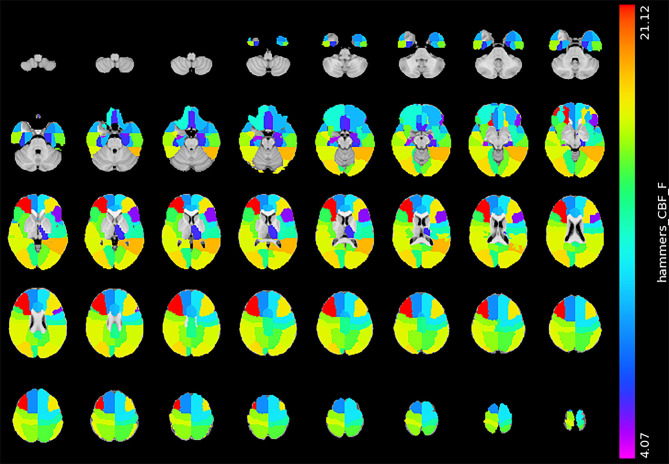
Figure 4.
Significant difference in CBF between the mild BG-PVS group and the severe BG-PVS group. The severe BG-PVS group shows a significantly lower CBF in the cortex and left thalamus (PFDR < 0.05, corrected for age, sex, scanner and regional GMV). The F-score bar is shown on the right. The left part of the figure represents the right side of the individual. CBF, gray matter cerebral blood flow; BG-PVS, basal ganglia perivascular spaces; GMV, gray matter volume.

