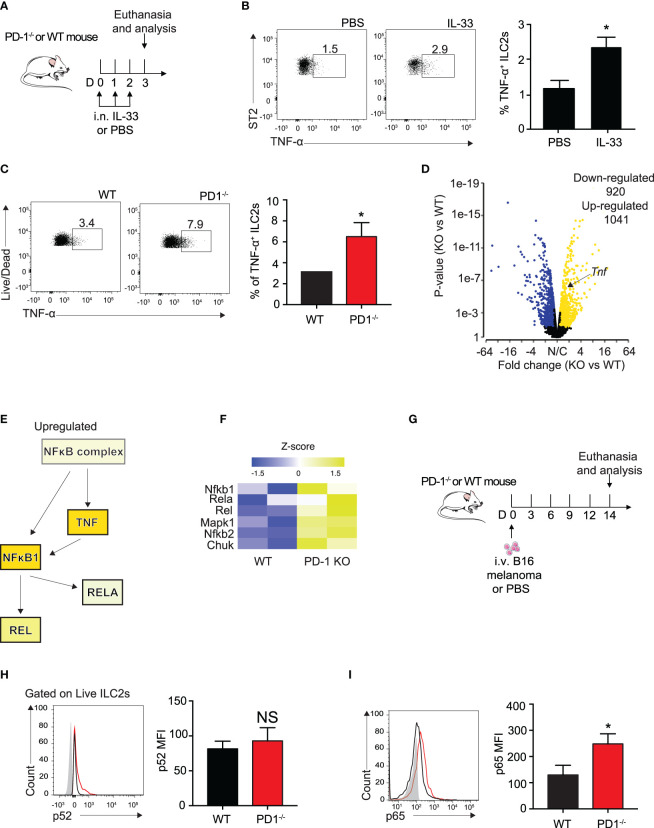
Figure 3.
PD-1 deficiency on IL-33 stimulated ILC2s enhances TNF-a expression and phosphorylation of canonical NFκB pathway. (A) A cohort of WT mice were intranasally challenged with IL-33 (0.5µg) for three consecutive days, days 0-2. On day 3, mice were euthanized and percentage of TNF-α+ ILCs was quantified in (B). (C) A cohort of WT or PD-1-/- mice were intranasally challenged with IL-33 (0.5µg) for three consecutive days, days 0-2. On day 3, mice were euthanized and percentage of TNF-α+ ILCs was quantified. (D) Volcano plot comparison of whole transcriptome gene expression of sorted PD-1-/- ILC2s and WT control, n=2. Differentially expressed genes (defined as statistically significant adjusted p-value<0.05) with changes of at least 1.45 fold-change (FC) are shown in yellow (upregulated genes) or blue (downregulated genes). (E) Upregulated (yellow) genes in the NFκB pathway and corresponding heatmap representation (F). (G) A cohort of PD-1-/- or WT mice was given an intravenous injection of B16 melanoma (2.5 x 10⁵) on day 0. On day 14, lung ILC2s were identified as defined in Figure 1C and transcription factors involved in the NFκB pathway were measured for phosphorylation by intranuclear flow cytometry. (H) Representative flow cytometry plots and corresponding quantification of phosphorylation levels of transcription factor p52. (I) Representative flow cytometry plots and corresponding quantification of phosphorylation levels of transcription factor p65. Error bars are the mean ± SEM. Data are representative of 3 individual experiments with n=5. Student’s t-test, NS = Non-statistical, *p < 0.05.

