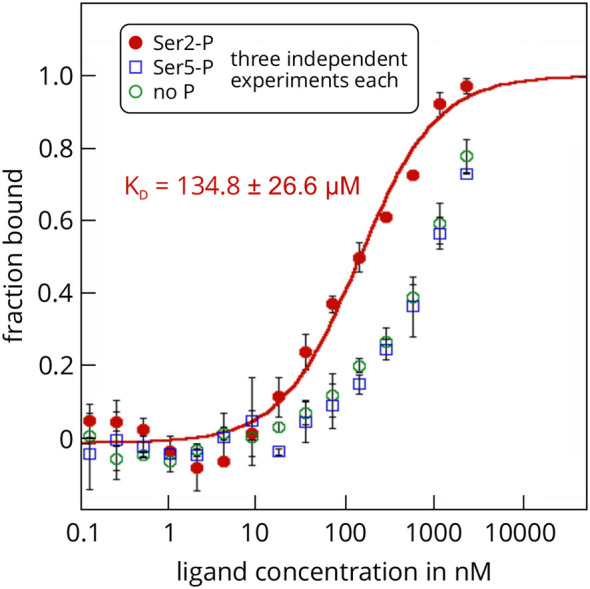
Figure 3. MST analysis of the interactions between GST-SPT6L(Phe1218-Asp1412) and three repeat peptides of the atRNAPII-CTD.

The protein SPT6L(Phe1218-Asp1412) served as the unlabelled ligand in this example and was added in increasing concentrations to the three FITC-labelled peptides that served as targets. The peptides resemble specific regions of the C-terminal domain of the A. thaliana RNA polymerase II and were either non-phosphorylated (green), or phosphorylated at Ser2 (red) or Ser5 (blue). Raw fluorescence data were normalized to the fraction of bound target. Error bars represent standard deviations from three individual repeat measurements. The KD was determined from a fit with the ‘ KD’ model to the law of mass action (R2 = 0.98). The figure is modified from Antosz et al., 2017 (www.plantcell.org, Copyright American Society of Plant Biologists).
