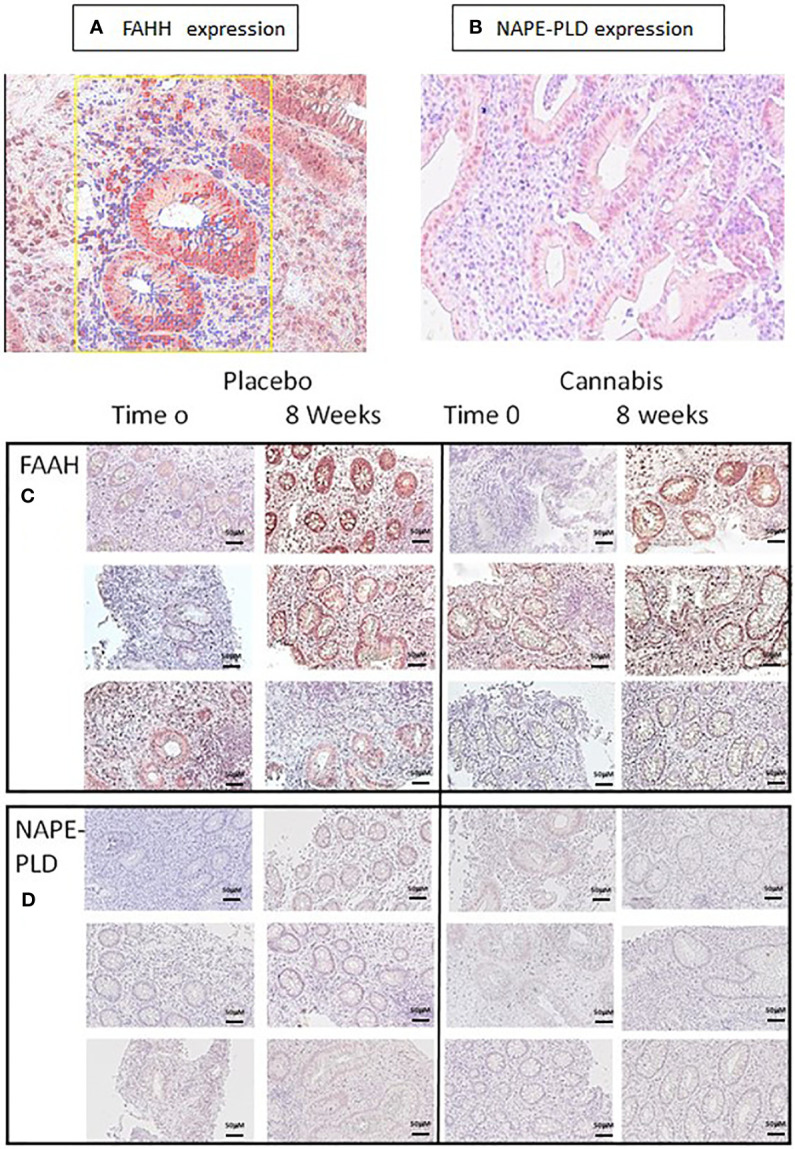
Figure 3.

FAAH and NAPE-PLD expression in colon biopsies. (A, C) FAAH and (B, D) NAPE-PLD expression were evaluated in colon biopsies using immunohistochemistry. The expression of the proteins in the images was measured using QuPath digital analysis tool. Presented are representative pictures of colon biopsies stained with (A) anti-FAAH and (B) anti-NAPE-PLD. The yellow square in panel (A) illustrates a QuPath reading. The red markings indicate a positive staining for FAAH, while the blue ones indicate staining with hematoxylin. (C, D) Images of FAAH and NAPE-PLD staining from three patients treated with placebo or cannabis at the beginning of the experiment and 8 weeks later.
