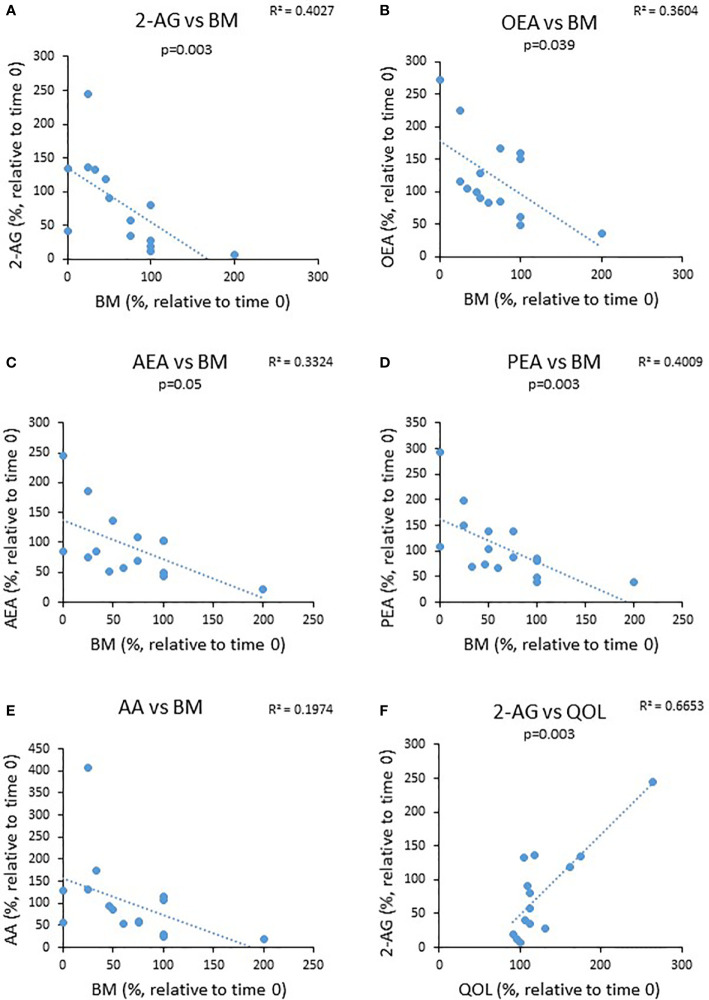
Figure 5.
The relationship between changes in eCBs level during the trial to changes in clinical parameters. UC patients were treated for 8 weeks with cannabis or placebo. eCBs level, BM, QOL and Mayo score were evaluated before the beginning of the experiment and 8 weeks later. The graphs describe the changes in BM as a function ofthe changes in the different eCBs level (A–E) and (F) the change in QOL as a function of 2-AG level.

