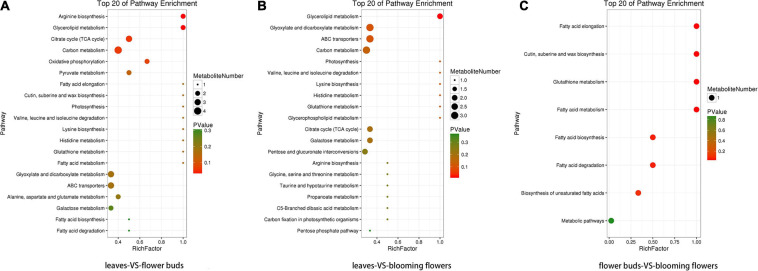
FIGURE 11.
Enriched KO pathway bubble diagrams. (A) Shows the enrichment of KO pathways in leaves and flower buds, and (B) shows the main KO pathways in which metabolites in leaves and blooming flowers are enriched. (C) Shows the enrichment of KO pathway in flower buds and blooming flowers. The top 20 Pathways with the smallest P value (or Q value) were used for mapping. The ordinate was Pathway, and the abscissa was enrichment factor (the number of differences in this pathway divided by all numbers). The size represented the number, and the redder the color, the smaller the P/Q value.

