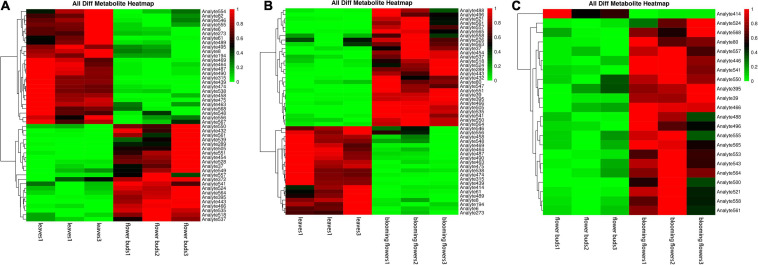
FIGURE 9.
Clustering heat maps of differentially abundant metabolites among Chrysanthemum dichrum plant tissues. The abscissa is the sample of each period, and the ordinate on the right is the name of the metabolite. The redder part of the heat map indicates the higher the metabolite content. (A) Is the differential metabolite clustering heat map of leaves and flower buds, and (B) is the differential metabolite clustering heat map of leaves and blooming flowers comparison group. (C) Is the heat map of different metabolites clustering between flower buds and blooming flowers comparison group. The abscissa is the sample of each period, and the ordinate on the right is the name of the metabolite. The redder part of the heat map indicates the higher the metabolite content.

