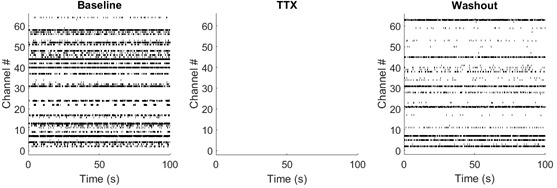
Figure 4. Representative raster plots of individual channel spiking activity from baseline, TTX treatment, and TTX washout.

Raster plots showing high spiking activity during baseline (A), which is completely abolished by application of 1 µM TTX (B), and is recovered after washout of TTX (C); x-axis corresponds to time, y-axis corresponds to channel.
