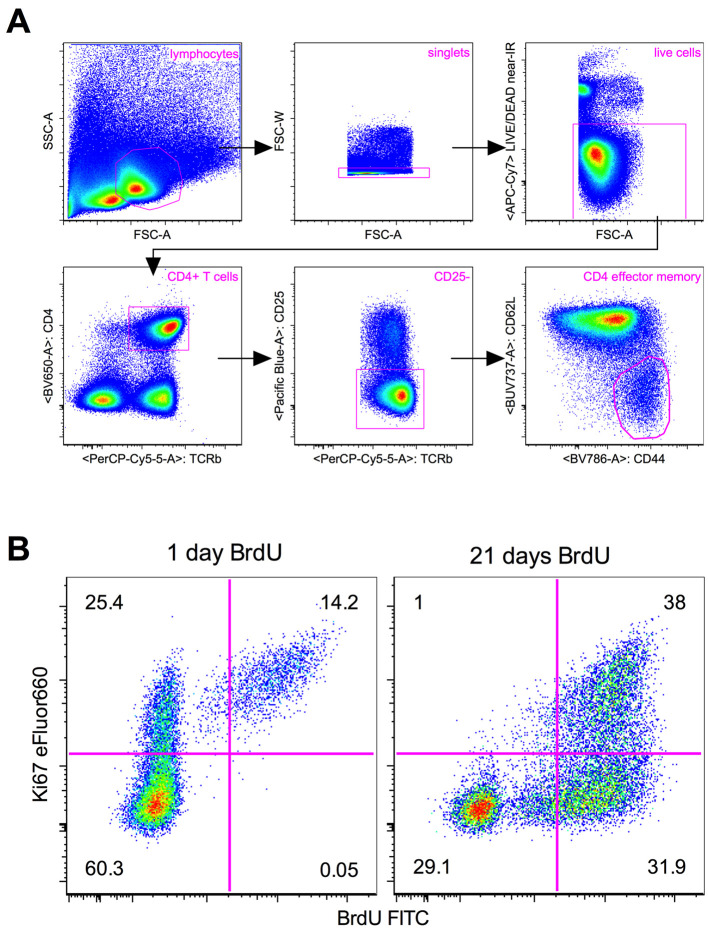
Figure 1. Example flow cytometry analysis.
(from Gossel et al., 2017 ). Representative flow cytometry plots showing (A) gating strategy for CD4 effector memory T cells (TCR+CD4+CD25-CD44hiCD62Llo) in lymph nodes, and (B) Ki67 and BrdU in CD4 effector memory T cells from the lymph nodes of mice treated with BrdU for either one day (left) or 21 days (right). Quadrant gates represent the division history of cells as follows: Ki67+BrdU- cells have recently divided (Ki67 lifetime 3-4 days) but have not incorporated BrdU. This may be due to either inefficient uptake of BrdU, or because the cell division did not take place within the BrdU treatment window. Ki67+BrdU+ cells have recently divided (Ki67 lifetime 3-4 days), and this cell division has taken place within the BrdU treatment window. Ki67-BrdU+ cells have divided at some time during the BrdU treatment window, but the lack of Ki67 expression indicates that this cell division was not recent (Ki67 lifetime 3-4 days). Ki67-BrdU- cells have either not divided at all, or have divided but subsequently lost expression of Ki67 (lifetime 3-4 days) and/or BrdU (due to either inefficient uptake of BrdU or label dilution through repeated cell divisions). Numbers indicate the percentage of cells within each quadrant.

