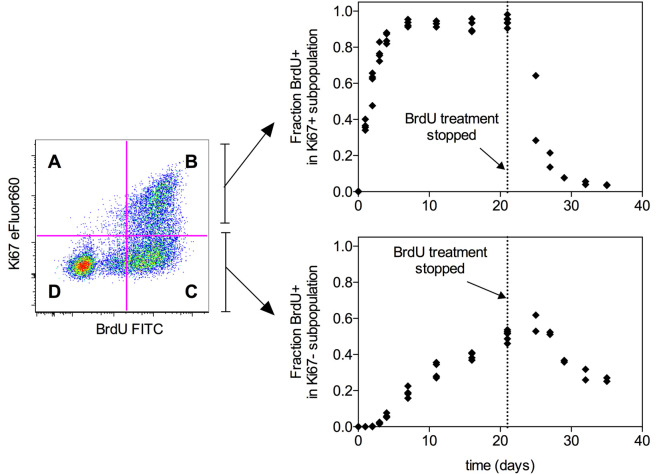
Figure 2. Example timecourse data.
(from Gossel et al., 2017 ). Graphs show the fraction of BrdU+ cells in either the Ki67+ or Ki67- subpopulation of CD4 effector memory T cells (TCR+CD4+CD25-CD44hiCD62Llo) in mouse lymph nodes. Each point represents one mouse. Mice were fed BrdU continuously for the indicated time periods up to 21 days. After 21 days, BrdU treatment was withdrawn and the delabelling timecourse was followed for a further 14 days. The fraction of BrdU+ cells within the Ki67+ subpopulation (top) is given by the formula B/(A+B) where A and B refer to the Ki67+BrdU- and Ki67+BrdU+ quadrants. The fraction of BrdU+ cells within the Ki67-+ subpopulation (bottom) is given by the formula C/(C+D) where C and D refer to the Ki67-BrdU+ and Ki67-BrdU- quadrants. These data can subsequently be used to fit mathematical models of T cell proliferation as described in Gossel et al. (2017) .

