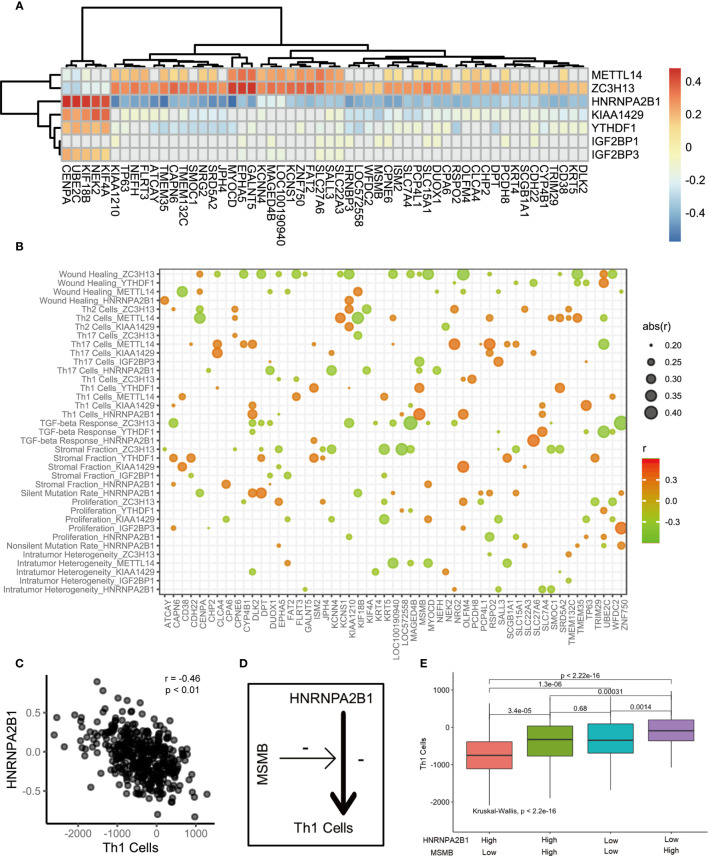
Figure 4.
The correlation of m6A regulators, immune cells and m6A associated genes. (A) The heatmap represented the correlation between key m6A regulators and key m6A associated genes. positive correlation was marked with red. negative correlation was marked with green. grey means p>0.05. (B) Bubble shown mean of correlation coefficient among m6A regulators, immune cells and m6A associated genes. The text on the left indicated the m6A regulators and immune cells. The text on the low represent m6A associated genes. mean of correlation coefficient were marked with size and color of circle. (C) The correlation between Th1 Cells and HNRNPA2B1. (D) The schematic diagram. (E) The median split was used to compare the effects of HNRNPA2B1 and MSMB on Th1 infiltration.

