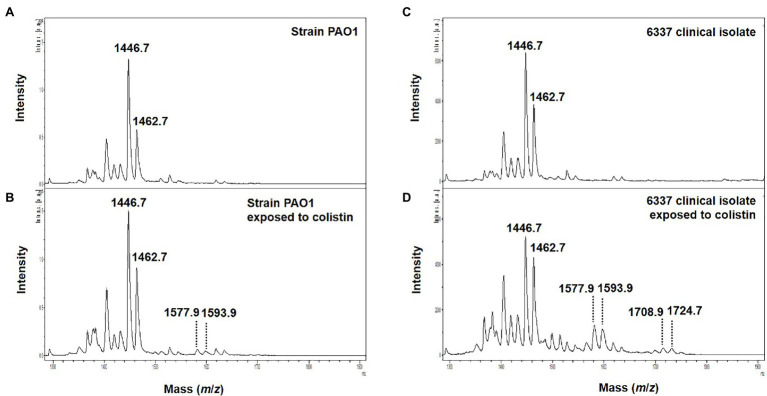
Figure 2.
Representative mass spectra of colistin induced susceptible and modified P. aeruginosa lipid A acquired using the linear negative-ion mode of a MALDI Biotyper Sirius system (Bruker Daltonics). (A) Susceptible P. aeruginosa PAO1 lipid A is detected as two major peaks at m/z 1,446.7 and m/z 1,462.7. (B) Colistin induced susceptible P. aeruginosa PAO1 lipid A with additional peaks at m/z 1,577.9, m/z 1,593.9 corresponding to L-Ara4N addition on the penta-acylated lipid A (peaks at m/z m/z 1,446.7 and m/z 1,462.7). (C) Lipid A from colistin-resistant P. aeruginosa clinical isolate 6,337 is detected as two major peaks at m/z 1,446.7 and m/z 1,462.7. (D) Colistin induced colistin-resistant P. aeruginosa clinical isolate 6,337 lipid A with additional peaks at m/z 1,577.9, m/z 1,593.9, m/z 1,708.9, and m/z 1,724.9 corresponding to L-Ara4N addition on the penta-acylated lipid A (peaks at m/z m/z 1,446.7 and m/z 1,462.7).

