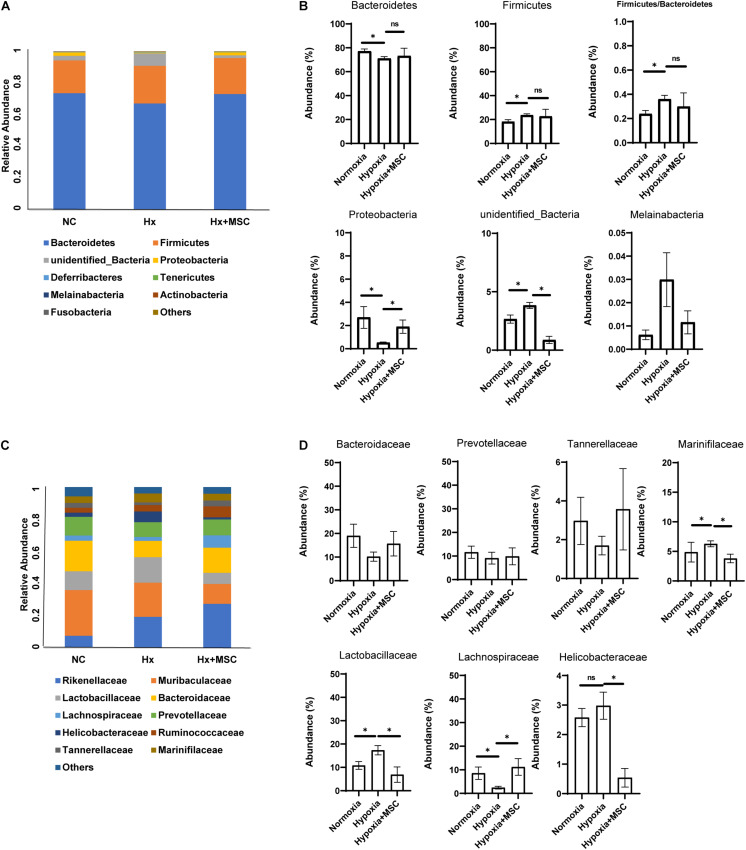
FIGURE 3.
Fecal microbial composition at the phylum level and family level. (A,B) The changes in Firmicutes, Bacteroidetes, Proteobacteria, unidentified_bacteria, Melainabateria, and the ratio of Firmicutes/Bacteroidetes. n = 4–5 per group; mean ± SEM; White’s non-parametric t-test, ∗P < 0.05. (C,D) The most abundant taxon changes at the family level. n = 4–5 per group; mean ± SEM; White’s non-parametric t-test, ∗P < 0.05.

