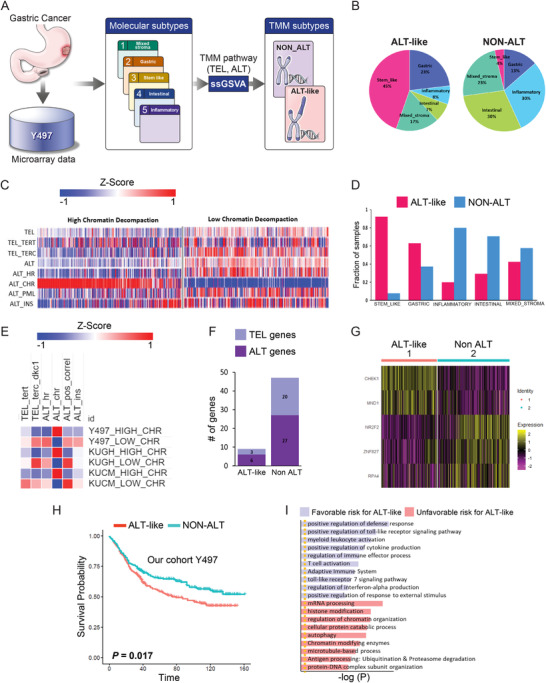
FIGURE 1.

Transcriptional telomere maintenance mechanism (TMM) analysis in gastric cancer (GC). (A) Overview of the analysis pipeline. (B) Pie chart showing the frequency distribution of molecular subtypes in alternative lengthening of telomeres ALT‐like (n = 254) and non‐ALT (n = 243) tumors: 45% stem‐like, 23% gastric, 8% inflammatory, 7% intestinal, 17% mixed stromal for ALT‐like; 30% inflammatory, 30% intestinal, 23% mixed stromal, 13% gastric, 4% stem‐like for non‐ALT. (C) TMM of ALT‐like and non‐ALT in 497 GC samples. Tel_TERT, telomere TERT pathway; Tel_TERC_DKC1, telomere TERC DKC1 pathway; ALT_HR, ALT homologous recombination pathway; ALT_CHR, ALT chromatin decompaction pathway; ALT_PML, ALT PML pathway; ALT_ins, ALT telomere instability pathway. p‐Values were calculated using a two‐sided Student's t‐test and adjusted for multiple testing (Benjamini‐Hochberg) using FDR correction. p < 0.05 was considered significant. The telomerase pathway consists of the TERT, TERC, and DKC1 pathways, with 38 genes. The ALT pathway includes four sub‐pathways: the homologous recombination (HR) pathway, chromatin decompaction pathway, PML pathway, and TERRA induction and telomere instability pathway, with 59 genes. We calculated eight pathway enrichment scores per sample and repeated the analysis 10,000,000 times to generate the background distribution of significant hits, from which we assessed whether the observed numbers were significantly higher than random expectation. For single‐sample gene set enrichment analysis (ssGSEA), we used the “GSVA” R package. Samples were classified as ALT‐like or non‐ALT based on FDR < 0.5 and chromatin status (“upregulated” or “downregulated”). Through this systematic analysis, each sample was assigned two telomere maintenance subtypes. Hierarchical clustering of log10‐transformed expression data was performed using the one minus Pearson correlation and the metric average method. (D) Bar graph showing the frequency distribution of ALT‐like and non‐ALT tumors according to molecular subtype: red indicates ALT‐like and blue indicates non‐ALT tumors. 92.30% stem‐like, 62.92% gastric, 42.42% mixed stromal, 29.41% intestinal, 20% inflammatory in ALT‐like, 7.69% stem‐like, 37.07% gastric, 80% inflammatory, 70.58% intestinal, and 57.57% for mixed stromal subtype in non‐ALT. (E) Heatmap of TMM in multiple cohorts. (F) Bar graph showing differentially expressed genes in TMM: three TEL genes and six ALT genes for ALT‐like, 20 TEL genes and 27 ALT genes for non‐ALT were significantly differentially expressed. (G) Heatmap of significantly overexpressed genes in ALT‐like versus non‐ALT tumors (H) Kaplan–Meier plots showing overall survival rates for the ALT‐like and non‐ALT groups. p‐values were calculated using the log‐rank test. (I) Gene ontology analysis of the ALT‐like and non‐ALT groups for the good patient outcome on non‐ALT in GC. ALT‐enriched biological pathways are indicated in blue and non‐ALT‐enriched biological pathways in red. Gene ontology (GO) describes gene products with three independent categories: biological process, cellular component, and molecular function.
