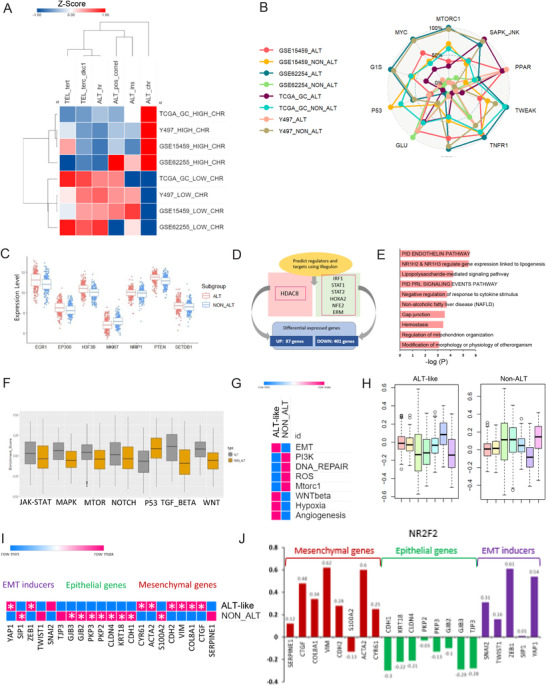
FIGURE 2.

Hallmarks of alternative lengthening of telomeres (ALT)‐like in GC. (A) Heatmap of telomere maintenance mechanism (TMM) in four different cohorts. (B) Spider plot of ALT‐like phenotypes among four cohorts. (C) Box plot of key genes involved in ALT‐like (p < 0.05). (D) Regulators in ALT‐like and non‐ALT predicted using iRegulon. Two hundred ninety genes were overexpressed in ALT‐like and 397 genes were overexpressed in non‐ALT tumors. (E) Transcription factor (TF) and targeted gene network for ALT. (F) Box plot for seven cancer signaling pathways in ALT‐like and non‐ALT: p53 (p < 2.22e–16), WNT (p < 2.22e–16), NOTCH (p = 0.0099), TGF‐BETA (p < 2.22e–16), JAK‐STAT (p = 0.0079), MAPK (p = 9.9e–16), and MTOR (p = 2.5e–08). To explore the biological processes associated with the TMM, we analyzed TMM, ALT‐like, and non‐ALT cancer hallmark pathways, including ROS, DNA damage, EMT, hypoxia, angiogenesis, and G2M. The seven selected cancer signaling pathways included p53, WNT, NOTCH, TGF‐BETA, JAK‐STAT, MAPK, mTOR signaling, and the gene sets were obtained from MSigDB (http://software.broadinstitute.org/gsea/msigdb). To evaluate pathway enrichment or depletion, we used ssGSEA in the “GSVA” R package. We calculated eight pathway enrichment scores per sample and repeated the analysis 10,000,000 times to generate the background distribution of significant hits, from which we assessed whether the observed numbers were significantly higher than random expectation. (G) Eight cancer hallmarks (PI3K, Mtorc1, WNT, G2M checkpoint, EMT, DNA repair, p53, ROS, hypoxia, and angiogenesis) and six TMM in ALT‐like and non‐ALT. Significant enrichments (FDR < 0.01) are indicated in pink or blue. Dark brown indicates the enrichment of a hallmark gene set in genes highly expressed in ALT. Blue indicates the opposite pattern. (H) Box plot for seven metabolic signature pathways in ALT‐like and non‐ALT. lipids (red): p = 0.1981, carbohydrates (yellow): p = 4.267e–07, TCA (yellow green): p = 2.442e–16, amino acids (green): p < 2.2e–16, vitamins (sky blue): p < 2.2e–16, energy (blue): p < 2.2e–16, nucleotides (purple): p < 2.2e–16 (I) Heatmap (pink indicates high expression and blue indicates low expression, FDR < 0.05) for EMT signatures: mesenchymal genes, epithelial genes, and EMT inducers. (J) Bar chart of correlations between EMT member genes and NR2F2 (red: mesenchymal genes, green: epithelial genes, EMT‐inducer genes). Abbreviations: Alternative lengthening of telomeres (ALT); epithelial‐mesenchymal transition (EMT); gastric cancer (GC); and telomere maintenance mechanism (TMM)
