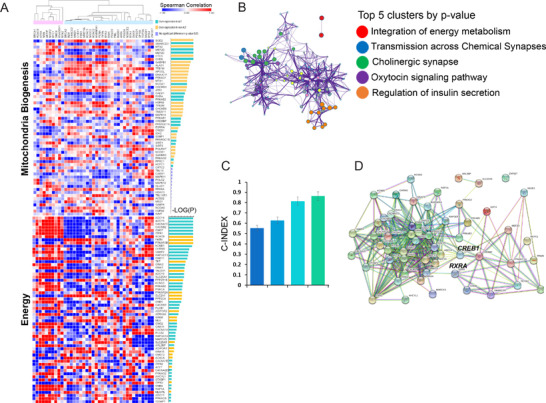
FIGURE 3.

Mitochondrial biogenesis and energy metabolism genes are enriched in ALT. (A) Heatmap of Pearson correlations between mitochondrial biogenesis, energy metabolism, and ALT genes. p‐Values were calculated using the Wilcoxon test and were Benjamini–Hochberg‐adjusted. Correlations between the expression levels for ALT genes and mitochondrial biogenesis genes are shown. Statistical significance is shown as –log10[adjusted p], where p < 0.05 corresponds to –log10[adjusted p] > 1.3. Dark red and dark blue indicate highly significant negative and positive correlations, respectively. (B) Top five gene clusters of genes enriched in ALT. (C) Power of risk prediction (C‐index) with ALT signature, EMT signature, and energy signature as well as all signature genes for distinct ALT activity in GC. Dark blue: ALT‐like, Blue: EMT, Sky blue: Energy, Green: Energy+ALT‐like+EMT. (D) Protein‐protein interactions between mitochondrial biogenesis genes and energy metabolism genes (hub genes: CREB1 and RXRA). Abbreviations: Alternative lengthening of telomeres (ALT); epithelial‐mesenchymal transition (EMT); gastric cancer (GC); and telomere maintenance mechanism (TMM)
