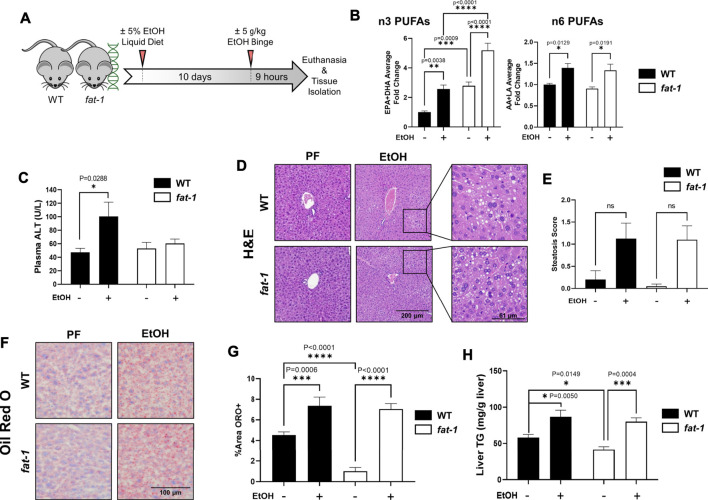
FIGURE 1.
Characterization of liver pathology in WT and fat-1 mice in an acute-on-chronic mouse model of ALD. (A) Experimental design, (B) liver n3-PUFA (EPA and DHA) and n6-PUFA (AA and LA) levels, (C) plasma ALT, (D) H&E staining, (E) quantitation of liver steatosis, (F) Oil Red O staining, (G) quantitation of Oil Red O staining, and (H) total liver triglycerides.. All images are 200X magnification. *p < 0.05, **p < 0.01, ***p < 0.001, ****p < 0.0001, one-way ANOVA (comparisons not significant if unlabeled). WT PF (n = 14), fat-1 PF (n = 9), WT EtOH (n = 8), fat-1 EtOH (n = 10).

