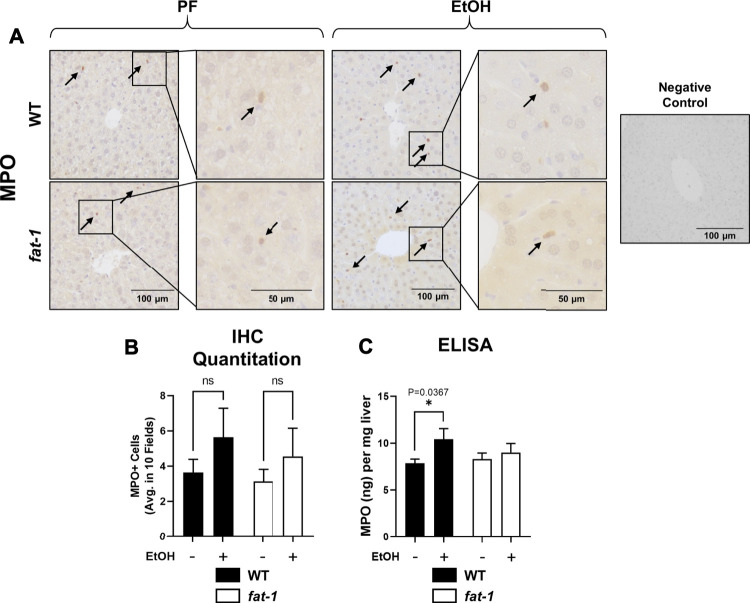
FIGURE 3.
Hepatic neutrophil infiltration. (A) Immunohistochemistry staining for MPO expression. Arrows indicate MPO+ cells. Images are 200X, insets are 400X magnification. (B) Quantitation of number of MPO+ cells in representative digital microscope fields. (C) MPO levels as determined by ELISA, p < 0.05, one-way ANOVA (comparisons not significant if unlabeled). WT PF (n = 14), fat-1 PF (n = 9), WT EtOH (n = 8), fat-1 EtOH (n = 10).

